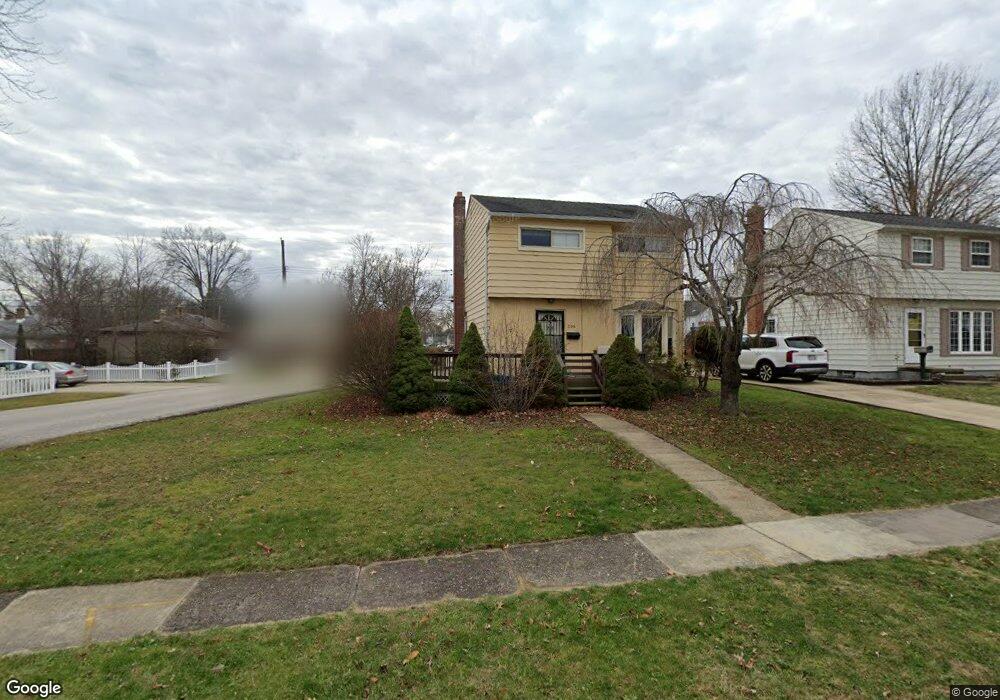
206 Tyler Ave Cuyahoga Falls, OH 44221
Mud Brook NeighborhoodEstimated Value: $178,000 - $220,000
3
Beds
2
Baths
1,078
Sq Ft
$188/Sq Ft
Est. Value
About This Home
This home is located at 206 Tyler Ave, Cuyahoga Falls, OH 44221 and is currently estimated at $202,425, approximately $187 per square foot. 206 Tyler Ave is a home located in Summit County with nearby schools including Lincoln Elementary School, Roberts Middle School, and Cuyahoga Falls High School.
Ownership History
Date
Name
Owned For
Owner Type
Purchase Details
Closed on
Jan 13, 2007
Sold by
Dougherty Kathleen Ann
Bought by
206 Tyler Ltd
Current Estimated Value
Purchase Details
Closed on
Dec 14, 2004
Sold by
Dougherty James J
Bought by
Dougherty Kathleen Ann and The Kathleen Dougherty Revocable Trust
Purchase Details
Closed on
Oct 11, 2001
Sold by
Hud
Bought by
Dougherty James J
Purchase Details
Closed on
Jul 31, 2001
Sold by
Sparks Royce D
Bought by
Hud
Purchase Details
Closed on
Oct 11, 1996
Sold by
Preston Richard L
Bought by
Sparks Royce D and Sparks Christina M
Home Financials for this Owner
Home Financials are based on the most recent Mortgage that was taken out on this home.
Original Mortgage
$90,951
Interest Rate
8.14%
Mortgage Type
FHA
Create a Home Valuation Report for This Property
The Home Valuation Report is an in-depth analysis detailing your home's value as well as a comparison with similar homes in the area
Home Values in the Area
Average Home Value in this Area
Purchase History
| Date | Buyer | Sale Price | Title Company |
|---|---|---|---|
| 206 Tyler Ltd | -- | Attorney | |
| Dougherty Kathleen Ann | $9,000 | -- | |
| Dougherty James J | $90,000 | Gateway Title Agency Inc | |
| Hud | $90,000 | -- | |
| Sparks Royce D | $91,000 | -- |
Source: Public Records
Mortgage History
| Date | Status | Borrower | Loan Amount |
|---|---|---|---|
| Previous Owner | Sparks Royce D | $90,951 |
Source: Public Records
Tax History Compared to Growth
Tax History
| Year | Tax Paid | Tax Assessment Tax Assessment Total Assessment is a certain percentage of the fair market value that is determined by local assessors to be the total taxable value of land and additions on the property. | Land | Improvement |
|---|---|---|---|---|
| 2025 | $2,853 | $51,667 | $10,493 | $41,174 |
| 2024 | $2,853 | $51,667 | $10,493 | $41,174 |
| 2023 | $2,853 | $51,667 | $10,493 | $41,174 |
| 2022 | $2,638 | $38,830 | $7,774 | $31,056 |
| 2021 | $2,638 | $38,830 | $7,774 | $31,056 |
| 2020 | $2,596 | $38,830 | $7,770 | $31,060 |
| 2019 | $2,642 | $36,000 | $7,460 | $28,540 |
| 2018 | $2,252 | $36,000 | $7,460 | $28,540 |
| 2017 | $1,939 | $36,000 | $7,460 | $28,540 |
| 2016 | $1,940 | $31,340 | $7,460 | $23,880 |
| 2015 | $1,939 | $31,340 | $7,460 | $23,880 |
| 2014 | $1,940 | $31,340 | $7,460 | $23,880 |
| 2013 | $2,044 | $33,320 | $7,460 | $25,860 |
Source: Public Records
Map
Nearby Homes
- 324 Madison Ave
- 229 Hayes Ave
- 418 Hayes Ave
- 3423 Bailey Rd
- 3166 7th St
- 218 Monroe Ave
- 306 Hollywood Ave
- 435 Roanoke Ave
- 3320 Hudson Dr
- 3452 Wyoga Lake Rd
- 3119 Meier Place
- 2890 Bailey Rd
- 3154 Prior Dr
- 3584 Brookside Rd
- 2873 Oakwood Dr
- 3106 Prior Dr
- 2855 6th St
- 455 Marguerite Ave
- 2886 Norwood St
- 419 Keenan Ave
- 212 Tyler Ave
- 218 Tyler Ave
- 130 Tyler Ave
- 3210 Elmwood St
- 3205 Elmwood St
- 224 Tyler Ave
- 131 Van Buren Ave
- 205 Tyler Ave
- 124 Tyler Ave
- 211 Tyler Ave
- 211 Van Buren Ave
- 125 Van Buren Ave
- 217 Tyler Ave
- 131 Tyler Ave
- 118 Tyler Ave
- 217 Van Buren Ave
- 223 Tyler Ave
- 119 Van Buren Ave
- 125 Tyler Ave
- 236 Tyler Ave