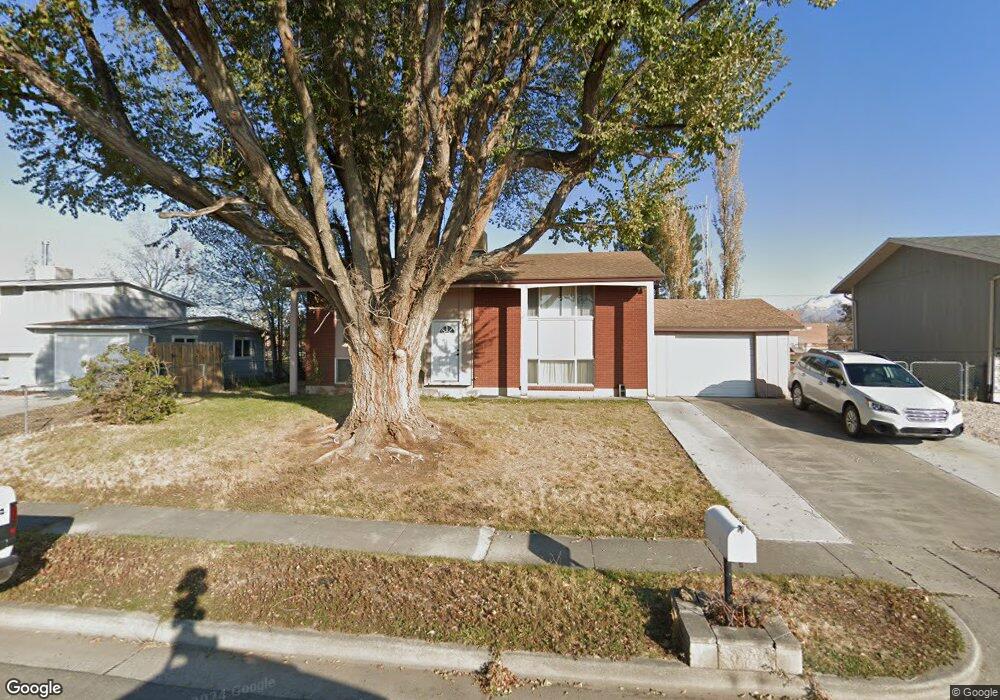
206 W 590 N Layton, UT 84041
Estimated Value: $387,852 - $449,000
4
Beds
2
Baths
931
Sq Ft
$441/Sq Ft
Est. Value
About This Home
This home is located at 206 W 590 N, Layton, UT 84041 and is currently estimated at $410,713, approximately $441 per square foot. 206 W 590 N is a home located in Davis County with nearby schools including Crestview Elementary School, Central Davis Junior High School, and Layton High School.
Ownership History
Date
Name
Owned For
Owner Type
Purchase Details
Closed on
Apr 25, 2008
Sold by
Webster F Scott
Bought by
Webster F Scott
Current Estimated Value
Home Financials for this Owner
Home Financials are based on the most recent Mortgage that was taken out on this home.
Original Mortgage
$106,500
Interest Rate
5.81%
Mortgage Type
New Conventional
Purchase Details
Closed on
Dec 19, 2003
Sold by
Webster F Scott and Webster Lisa Kim
Bought by
Webster F Scott
Home Financials for this Owner
Home Financials are based on the most recent Mortgage that was taken out on this home.
Original Mortgage
$110,000
Interest Rate
6.3%
Mortgage Type
New Conventional
Purchase Details
Closed on
Jun 22, 1998
Sold by
Webster Scott F
Bought by
Webster F Scott and Webster Lisa Kim
Purchase Details
Closed on
Mar 10, 1997
Sold by
Webster F Scott and Webster Scott F
Bought by
Webster F Scott and Webster Lisa Kim
Create a Home Valuation Report for This Property
The Home Valuation Report is an in-depth analysis detailing your home's value as well as a comparison with similar homes in the area
Home Values in the Area
Average Home Value in this Area
Purchase History
| Date | Buyer | Sale Price | Title Company |
|---|---|---|---|
| Webster F Scott | -- | Inwest Title Services Inc | |
| Webster F Scott | -- | Meridian Title Company | |
| Webster F Scott | -- | First American Title Co | |
| Webster F Scott | -- | -- |
Source: Public Records
Mortgage History
| Date | Status | Borrower | Loan Amount |
|---|---|---|---|
| Closed | Webster F Scott | $106,500 | |
| Closed | Webster F Scott | $110,000 |
Source: Public Records
Tax History Compared to Growth
Tax History
| Year | Tax Paid | Tax Assessment Tax Assessment Total Assessment is a certain percentage of the fair market value that is determined by local assessors to be the total taxable value of land and additions on the property. | Land | Improvement |
|---|---|---|---|---|
| 2025 | $1,865 | $195,800 | $100,597 | $95,203 |
| 2024 | $1,836 | $194,150 | $117,300 | $76,850 |
| 2023 | $1,803 | $336,000 | $140,239 | $195,761 |
| 2022 | $1,777 | $179,850 | $73,912 | $105,938 |
| 2021 | $1,689 | $255,000 | $103,059 | $151,941 |
| 2020 | $1,526 | $221,000 | $86,977 | $134,023 |
| 2019 | $1,516 | $215,000 | $82,846 | $132,154 |
| 2018 | $1,362 | $194,000 | $82,846 | $111,154 |
| 2016 | $1,176 | $86,405 | $26,501 | $59,904 |
| 2015 | $1,021 | $71,181 | $26,501 | $44,680 |
| 2014 | $832 | $59,318 | $26,501 | $32,817 |
| 2013 | -- | $75,583 | $18,612 | $56,971 |
Source: Public Records
Map
Nearby Homes
- 495 Spurlock St
- 480 Spurlock St
- 441 Church St
- 6 Grover St
- 526 King St Unit 2
- 142 Green Dr
- 356 W 25 N
- 485 W 100 N
- 355 W Gentile St
- 1180 N 100 E
- 103 W 1275 N
- 785 Sherwood Dr
- 937 Rainbow Dr
- 157 N Fort Ln Unit A
- 174 W Dawson St
- 750 W Gentile St
- 324 E 1325 N
- 1113 W Angel Hill Ct
- 1366 N Main St Unit 5
- 794 Valeria Dr