Estimated Value: $227,000 - $278,000
4
Beds
2
Baths
1,965
Sq Ft
$131/Sq Ft
Est. Value
About This Home
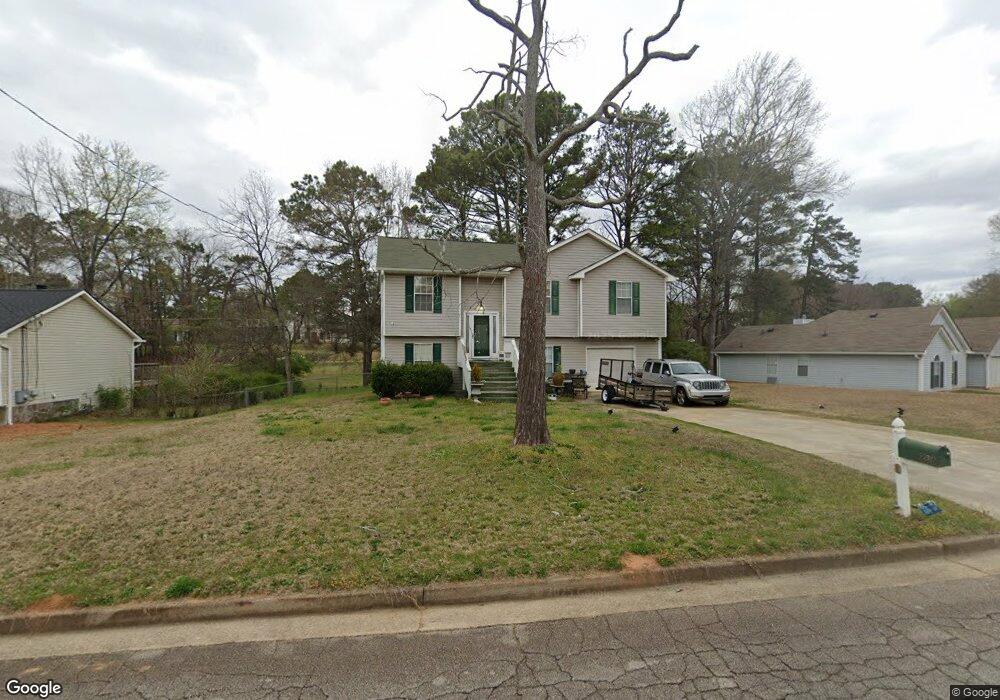
This home is located at 206 Wagon Wheel Dr, Rex, GA 30273 and is currently estimated at $256,770, approximately $130 per square foot. 206 Wagon Wheel Dr is a home located in Henry County with nearby schools including Fairview Elementary School, Austin Road Middle School, and Stockbridge High School.
Ownership History
Date
Name
Owned For
Owner Type
Purchase Details
Closed on
May 31, 2007
Sold by
Dickerson Lloyd
Bought by
Copeland Mack
Current Estimated Value
Home Financials for this Owner
Home Financials are based on the most recent Mortgage that was taken out on this home.
Original Mortgage
$111,000
Outstanding Balance
$67,333
Interest Rate
6.12%
Mortgage Type
New Conventional
Estimated Equity
$189,437
Purchase Details
Closed on
Jun 15, 2001
Sold by
Community Homes Svcs Ltd
Bought by
Dickenson Lloyd
Home Financials for this Owner
Home Financials are based on the most recent Mortgage that was taken out on this home.
Original Mortgage
$105,346
Interest Rate
7.23%
Mortgage Type
FHA
Purchase Details
Closed on
Feb 6, 2001
Sold by
Bolton Jonathan and Bolton Deloreia
Bought by
Countrywide Hm Lns Inc
Purchase Details
Closed on
Dec 13, 1996
Sold by
Reeves Homes Nancy
Bought by
Bolton Jonathan Deboreia
Create a Home Valuation Report for This Property
The Home Valuation Report is an in-depth analysis detailing your home's value as well as a comparison with similar homes in the area
Home Values in the Area
Average Home Value in this Area
Purchase History
| Date | Buyer | Sale Price | Title Company |
|---|---|---|---|
| Copeland Mack | $111,000 | -- | |
| Dickenson Lloyd | $107,000 | -- | |
| Countrywide Hm Lns Inc | $116,169 | -- | |
| Bolton Jonathan Deboreia | $97,900 | -- |
Source: Public Records
Mortgage History
| Date | Status | Borrower | Loan Amount |
|---|---|---|---|
| Open | Copeland Mack | $111,000 | |
| Previous Owner | Dickenson Lloyd | $105,346 | |
| Closed | Bolton Jonathan Deboreia | $0 |
Source: Public Records
Tax History
| Year | Tax Paid | Tax Assessment Tax Assessment Total Assessment is a certain percentage of the fair market value that is determined by local assessors to be the total taxable value of land and additions on the property. | Land | Improvement |
|---|---|---|---|---|
| 2025 | $2,988 | $107,480 | $14,000 | $93,480 |
| 2024 | $2,988 | $108,240 | $14,000 | $94,240 |
| 2023 | $2,555 | $106,920 | $14,000 | $92,920 |
| 2022 | $2,256 | $72,880 | $10,000 | $62,880 |
| 2021 | $1,895 | $57,600 | $10,000 | $47,600 |
| 2020 | $1,767 | $52,200 | $6,000 | $46,200 |
| 2019 | $1,455 | $43,960 | $6,000 | $37,960 |
| 2018 | $1,266 | $39,040 | $6,000 | $33,040 |
| 2016 | $1,240 | $38,360 | $4,800 | $33,560 |
| 2015 | $1,058 | $33,040 | $4,000 | $29,040 |
| 2014 | $888 | $28,560 | $4,000 | $24,560 |
Source: Public Records
Map
Nearby Homes
- 245 Remington Trail
- 5679 Jubilant Dr
- 260 Remington Trail Unit 2
- 51 Ac Rex Rd
- 232 Clarkdell Dr
- 4609 Rex Rd
- 350 Roundup Trail
- 176 Stokes Dr
- 80 Triple Crown Ln
- 40 Belmont Park Ln
- 190 Belmont Farms Dr
- 125 Belmont Farms Dr
- 35 Triple Crown Ln
- 3839 Teton Pass
- 5747 Rex Mill Creek
- 160 Leyland Cypress Way
- 51 AC Rex Rd
- 3777 Teton Pass
- 5847 Pinetree Ln
- 2132 E Atlanta Rd
- 200 Wagon Wheel Dr
- 200 Wagon Wheel Dr Unit IV
- 212 Wagon Wheel Dr Unit IV
- 170 Orchard Rd Unit 4
- 218 Wagon Wheel Dr
- 194 Wagon Wheel Dr Unit IV
- 213 Wagon Wheel Dr Unit 4
- 207 Wagon Wheel Dr Unit 4
- 174 Orchard Rd Unit IV
- 219 Wagon Wheel Dr
- 201 Wagon Wheel Dr
- 231 Wagon Wheel Dr Unit 6
- 188 Wagon Wheel Dr
- 195 Wagon Wheel Dr Unit IV
- 191 Wagon Wheel Dr
- 225 Wagon Wheel Dr Unit 4
- 178 Orchard Rd
- 178 Orchard Rd Unit IV
- 97 Orchard Rd Unit 1
- 4331 Rex Rd
Your Personal Tour Guide
Ask me questions while you tour the home.