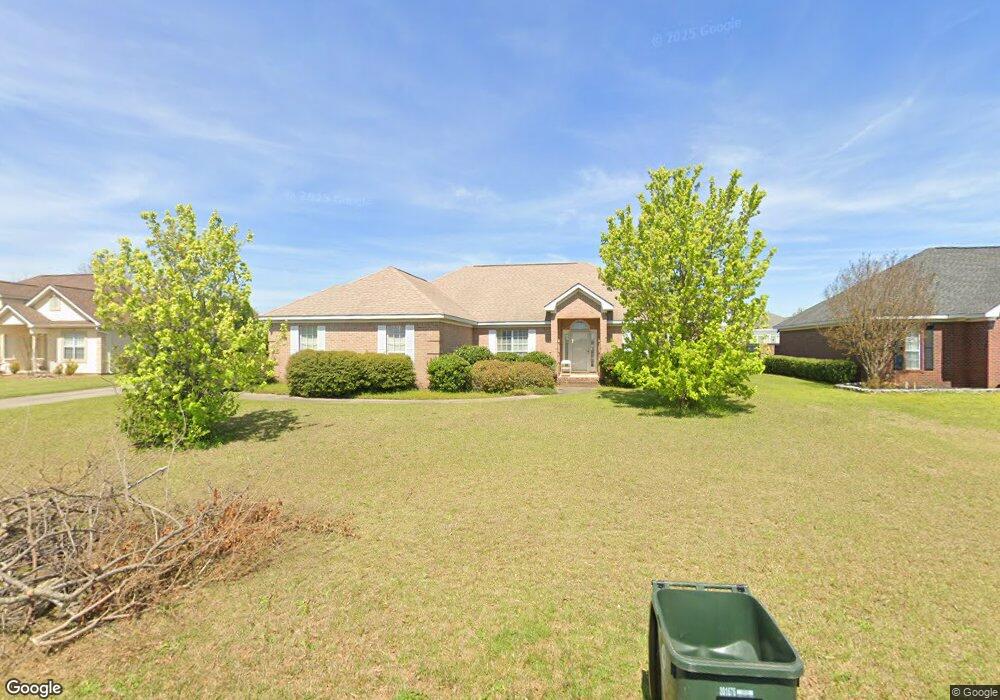
206 Weeping Willow Way Warner Robins, GA 31093
Estimated Value: $260,201 - $310,000
3
Beds
2
Baths
1,992
Sq Ft
$139/Sq Ft
Est. Value
About This Home
This home is located at 206 Weeping Willow Way, Warner Robins, GA 31093 and is currently estimated at $276,550, approximately $138 per square foot. 206 Weeping Willow Way is a home located in Houston County with nearby schools including Eagle Springs Elementary School, Thomson Middle School, and Northside High School.
Ownership History
Date
Name
Owned For
Owner Type
Purchase Details
Closed on
Jun 16, 2022
Sold by
United Community Bank
Bought by
Edgar Hughston Builder Inc
Current Estimated Value
Home Financials for this Owner
Home Financials are based on the most recent Mortgage that was taken out on this home.
Original Mortgage
$393,150
Interest Rate
5.27%
Mortgage Type
VA
Purchase Details
Closed on
Jun 15, 2022
Sold by
Edgar Hughston Builder Inc
Bought by
Orman Seth
Home Financials for this Owner
Home Financials are based on the most recent Mortgage that was taken out on this home.
Original Mortgage
$393,150
Interest Rate
5.27%
Mortgage Type
VA
Purchase Details
Closed on
Jan 25, 1999
Sold by
Mcdaniel James C and Danielle M*
Bought by
Nguyen Tai Tan and Huynh Mai Xuan*
Purchase Details
Closed on
Jul 28, 1997
Sold by
Pamperian Roka D
Bought by
Mcdaniel James C and Danielle M*
Purchase Details
Closed on
May 23, 1996
Bought by
Pamperian Roka D
Create a Home Valuation Report for This Property
The Home Valuation Report is an in-depth analysis detailing your home's value as well as a comparison with similar homes in the area
Home Values in the Area
Average Home Value in this Area
Purchase History
| Date | Buyer | Sale Price | Title Company |
|---|---|---|---|
| Edgar Hughston Builder Inc | -- | None Listed On Document | |
| Orman Seth | $393,200 | Cooper Law Firm Llc | |
| Nguyen Tai Tan | $129,000 | -- | |
| Mcdaniel James C | $121,300 | -- | |
| Pamperian Roka D | -- | -- |
Source: Public Records
Mortgage History
| Date | Status | Borrower | Loan Amount |
|---|---|---|---|
| Previous Owner | Orman Seth | $393,150 |
Source: Public Records
Tax History Compared to Growth
Tax History
| Year | Tax Paid | Tax Assessment Tax Assessment Total Assessment is a certain percentage of the fair market value that is determined by local assessors to be the total taxable value of land and additions on the property. | Land | Improvement |
|---|---|---|---|---|
| 2024 | $3,006 | $93,240 | $9,200 | $84,040 |
| 2023 | $2,622 | $80,920 | $9,200 | $71,720 |
| 2022 | $1,621 | $72,520 | $8,000 | $64,520 |
| 2021 | $1,431 | $63,880 | $8,000 | $55,880 |
| 2020 | $1,394 | $62,000 | $6,800 | $55,200 |
| 2019 | $1,343 | $59,800 | $6,800 | $53,000 |
| 2018 | $1,343 | $59,800 | $6,800 | $53,000 |
| 2017 | $1,344 | $59,800 | $6,800 | $53,000 |
| 2016 | $1,346 | $59,800 | $6,800 | $53,000 |
| 2015 | -- | $59,800 | $6,800 | $53,000 |
| 2014 | -- | $59,800 | $6,800 | $53,000 |
| 2013 | -- | $59,800 | $6,800 | $53,000 |
Source: Public Records
Map
Nearby Homes
- 113 Park Ln
- 105 Park Ln
- 32 Willow Lake Dr
- 801 Osigian Blvd
- 813 Osigian Blvd
- 307 Lasso Dr
- 109 Creek Bluff Trail
- 236 Beau Claire Cir
- 238 Beau Claire Cir
- 240 Beau Claire Cir
- 114 Lasso Dr
- 202 Fall Harvest
- 0 Gunn Rd Unit 10620588
- Maple Plan at
- Belmont Plan at
- Oakwood Plan at
- Cannaberra Plan at
- Jackson Plan at
- Hawthorn Plan at
- Camden Plan at
- 204 Weeping Willow Way
- 208 Weeping Willow Way
- 104 Blackberry Ln
- 106 Blackberry Ln
- 202 Weeping Willow Way
- 210 Weeping Willow Way
- 102 Blackberry Ln
- 207 Weeping Willow Way
- 209 Weeping Willow Way
- 205 Weeping Willow Way
- 211 Weeping Willow Way
- 212 Weeping Willow Way
- 100 Blackberry Ln
- 100 Huckleberry Trail
- 203 Weeping Willow Way
- 108 Blackberry Ln
- 103 Elderberry Ct
- 213 Weeping Willow Way
- 103 Blackberry Ln
- 105 Blackberry Ln