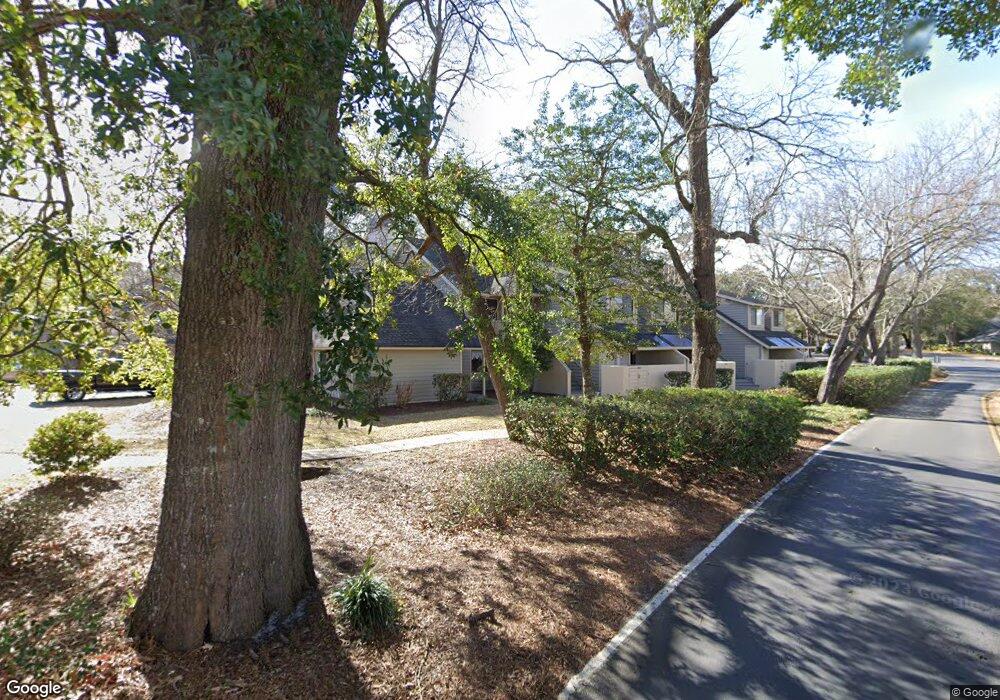
206 Westleton Dr Unit 12-E West Hyde Park Myrtle Beach, SC 29572
Arcadian Shores NeighborhoodEstimated Value: $389,539 - $450,000
3
Beds
2
Baths
1,376
Sq Ft
$305/Sq Ft
Est. Value
About This Home
This home is located at 206 Westleton Dr Unit 12-E West Hyde Park, Myrtle Beach, SC 29572 and is currently estimated at $420,135, approximately $305 per square foot. 206 Westleton Dr Unit 12-E West Hyde Park is a home located in Horry County with nearby schools including Myrtle Beach Child Development Center, Myrtle Beach Elementary School, and Myrtle Beach Primary School.
Ownership History
Date
Name
Owned For
Owner Type
Purchase Details
Closed on
May 10, 2019
Sold by
Brawner Michael K
Bought by
Vermitsky John Carl and Vermitsky Natalie Maria
Current Estimated Value
Home Financials for this Owner
Home Financials are based on the most recent Mortgage that was taken out on this home.
Original Mortgage
$198,750
Outstanding Balance
$174,387
Interest Rate
4.1%
Mortgage Type
New Conventional
Estimated Equity
$245,748
Purchase Details
Closed on
Jun 9, 2005
Sold by
Boodro Bryan and Hrisko William C
Bought by
Brawner Michael K and Brawner Linda C
Home Financials for this Owner
Home Financials are based on the most recent Mortgage that was taken out on this home.
Original Mortgage
$435,500
Interest Rate
6%
Mortgage Type
Fannie Mae Freddie Mac
Purchase Details
Closed on
Apr 1, 2005
Sold by
Rcsi Properties
Bought by
Boodro Bryan and Hrisko William C
Create a Home Valuation Report for This Property
The Home Valuation Report is an in-depth analysis detailing your home's value as well as a comparison with similar homes in the area
Home Values in the Area
Average Home Value in this Area
Purchase History
| Date | Buyer | Sale Price | Title Company |
|---|---|---|---|
| Vermitsky John Carl | $265,000 | -- | |
| Brawner Michael K | $435,500 | -- | |
| Boodro Bryan | $255,000 | -- |
Source: Public Records
Mortgage History
| Date | Status | Borrower | Loan Amount |
|---|---|---|---|
| Open | Vermitsky John Carl | $198,750 | |
| Previous Owner | Brawner Michael K | $435,500 |
Source: Public Records
Tax History Compared to Growth
Tax History
| Year | Tax Paid | Tax Assessment Tax Assessment Total Assessment is a certain percentage of the fair market value that is determined by local assessors to be the total taxable value of land and additions on the property. | Land | Improvement |
|---|---|---|---|---|
| 2024 | $3,667 | $23,040 | $0 | $23,040 |
| 2023 | $3,667 | $27,090 | $0 | $27,090 |
| 2021 | $3,382 | $27,090 | $0 | $27,090 |
| 2020 | $3,219 | $27,090 | $0 | $27,090 |
| 2019 | $2,973 | $24,990 | $0 | $24,990 |
| 2018 | $0 | $24,465 | $0 | $24,465 |
| 2017 | $3,003 | $13,980 | $0 | $13,980 |
| 2016 | -- | $13,980 | $0 | $13,980 |
| 2015 | $3,003 | $24,465 | $0 | $24,465 |
| 2014 | $2,902 | $13,980 | $0 | $13,980 |
Source: Public Records
Map
Nearby Homes
- 311 Cumberland Terrace Dr Unit 7-E
- 210 Westleton Dr Unit 13-D
- 800 Castleford Cir Unit 1-E
- 800 Castleford Cir Unit 1-H
- 800 Castleford Cir Unit 1-C
- 238 Westleton Dr Unit 22D
- 820 Castleford Cir Unit 6-D
- 9617 Sandpiper Ct
- 175 Saint Clears Way Unit 23-I
- 175 Saint Clears Way Unit 23A
- 104 High Cir Unit 8C
- 104 High Cir Unit 8H
- 428 Appledore Cir Unit 1-C
- 9700 Kings Rd
- 9700 Kings Rd Unit 288
- 9700 Kings Rd Unit Site G282
- 9700 Kings Rd Unit MH 259
- 9700 Kings Rd Unit 86
- 9700 Kings Rd Unit G278
- 9700 Kings Rd Unit 241
- 206 Westleton Dr Unit 12-F W HYDE PAR
- 206 Westleton Dr Unit 12-B West Hyde Park
- 206 Westleton Dr Unit 12-F West Hyde
- 206 Westleton Dr Unit 12-A West Hyde Park
- 206 Westleton Dr Unit 12-C
- 206 Westleton Dr Unit 12-C West Hyde Park
- 206 Westleton Dr Unit WEST HYDE PARK 12C
- 206 W Hyde Park Unit 12-I
- 206 Westleton Dr Unit 12G
- 206 Westleton Dr Unit 12F
- 206 Westleton Dr Unit 12E
- 206 Westleton Dr Unit 12B
- 206 Westleton Dr Unit 12-D
- 206 Westleton Dr Unit 12-A
- 208 Westleton Dr
- 208 Westleton Dr Unit 14-B
- 5-D Canterbury Ct Unit 816 Castleford Circl
- 311 Cumberland Terrace Dr Unit 7-B Cumberland Terra
- 311 Cumberland Terrace Dr Unit 7-C Cumberland Terra
- 311 Cumberland Terrace Dr Unit 7C