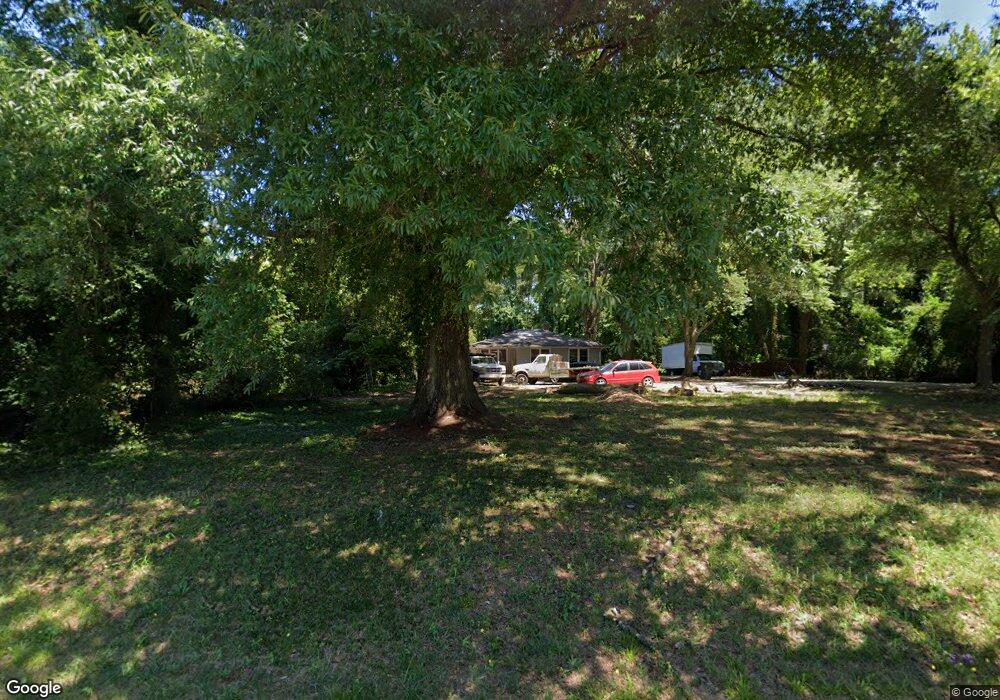
206 Weston Rd Garner, NC 27529
Estimated Value: $244,000 - $293,000
Studio
1
Bath
1,008
Sq Ft
$271/Sq Ft
Est. Value
About This Home
This home is located at 206 Weston Rd, Garner, NC 27529 and is currently estimated at $273,037, approximately $270 per square foot. 206 Weston Rd is a home located in Wake County with nearby schools including Creech Road Elementary School, North Garner Middle, and Garner High.
Ownership History
Date
Name
Owned For
Owner Type
Purchase Details
Closed on
Mar 24, 2021
Sold by
Nace Carlene B and Nace Kirk
Bought by
Rivera Jaris Alvarenga and De Alvarenga Mayling
Current Estimated Value
Home Financials for this Owner
Home Financials are based on the most recent Mortgage that was taken out on this home.
Original Mortgage
$172,000
Interest Rate
3.1%
Mortgage Type
New Conventional
Purchase Details
Closed on
Dec 11, 2018
Sold by
Tunstall Clyde Thomas and Tunstall Jean C
Bought by
Nace Carlene B
Home Financials for this Owner
Home Financials are based on the most recent Mortgage that was taken out on this home.
Original Mortgage
$115,200
Interest Rate
4.8%
Mortgage Type
New Conventional
Purchase Details
Closed on
Jul 14, 2006
Sold by
Whitehead Carl W and Whitehead William Edward
Bought by
Tunstall Clyde Thomas and Tunstall Jean C
Create a Home Valuation Report for This Property
The Home Valuation Report is an in-depth analysis detailing your home's value as well as a comparison with similar homes in the area
Home Values in the Area
Average Home Value in this Area
Purchase History
| Date | Buyer | Sale Price | Title Company |
|---|---|---|---|
| Rivera Jaris Alvarenga | $215,000 | None Available | |
| Nace Carlene B | $128,000 | None Available | |
| Tunstall Clyde Thomas | $42,000 | None Available |
Source: Public Records
Mortgage History
| Date | Status | Borrower | Loan Amount |
|---|---|---|---|
| Previous Owner | Rivera Jaris Alvarenga | $172,000 | |
| Previous Owner | Nace Carlene B | $115,200 |
Source: Public Records
Tax History
| Year | Tax Paid | Tax Assessment Tax Assessment Total Assessment is a certain percentage of the fair market value that is determined by local assessors to be the total taxable value of land and additions on the property. | Land | Improvement |
|---|---|---|---|---|
| 2025 | $2,538 | $242,773 | $154,000 | $88,773 |
| 2024 | $2,529 | $242,773 | $154,000 | $88,773 |
Source: Public Records
Map
Nearby Homes
- 209 Weston Rd
- 420 Johnson St
- 104 Westonridge Run
- 801 Powell Dr
- 130 Muirfield Ridge Dr
- 406 Avery St
- 113 Johnson St
- 1320 W Garner Rd Unit 100
- 1320 W Garner Rd Unit 103
- 1320 W Garner Rd Unit 101
- 1320 W Garner Rd Unit 102
- 1320 W Garner Rd
- 500 Oak Reserve Rd Unit 103
- 500 Oak Reserve Rd Unit 102
- 500 Oak Reserve Rd Unit 100
- 1600 Cranston Rd
- 3904 Cobb St
- 201 Creech Rd
- 215 Harper St
- 00-00 Creech Rd
Your Personal Tour Guide
Ask me questions while you tour the home.