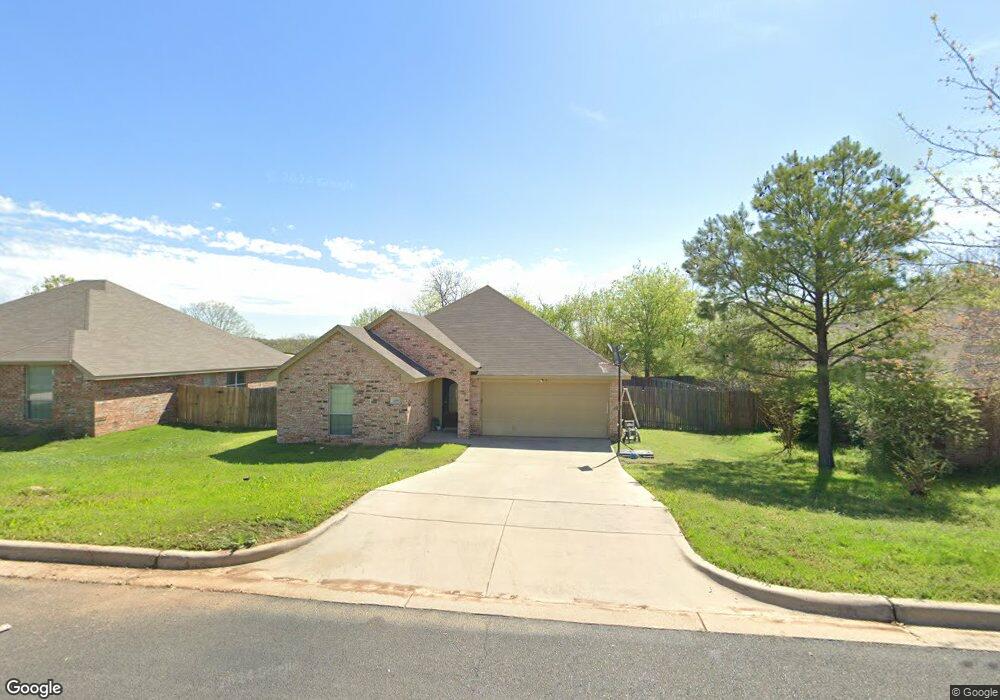
206 Willow Creek Dr Unit DRIVE Weatherford, TX 76085
Estimated Value: $282,032 - $326,000
--
Bed
2
Baths
1,654
Sq Ft
$189/Sq Ft
Est. Value
About This Home
This home is located at 206 Willow Creek Dr Unit DRIVE, Weatherford, TX 76085 and is currently estimated at $313,258, approximately $189 per square foot. 206 Willow Creek Dr Unit DRIVE is a home located in Parker County with nearby schools including Crockett Elementary School, Tison Middle School, and Weatherford High School.
Ownership History
Date
Name
Owned For
Owner Type
Purchase Details
Closed on
Apr 4, 2013
Sold by
American Residential Properties Op Lp
Bought by
American Residential Leasing Company Llc
Current Estimated Value
Purchase Details
Closed on
Dec 12, 2012
Sold by
Focused Real Property Solutions Llc
Bought by
American Residential Properties Op Lp
Purchase Details
Closed on
Aug 30, 2011
Sold by
Fannie Mae
Bought by
Focused Real Property Solutions Llc
Purchase Details
Closed on
Mar 1, 2011
Sold by
Eng George E
Bought by
Federal National Mortgage Association
Purchase Details
Closed on
Jun 23, 2006
Sold by
Martin Custom Homes Llc
Bought by
Eng George E
Home Financials for this Owner
Home Financials are based on the most recent Mortgage that was taken out on this home.
Original Mortgage
$92,800
Interest Rate
6.63%
Mortgage Type
New Conventional
Create a Home Valuation Report for This Property
The Home Valuation Report is an in-depth analysis detailing your home's value as well as a comparison with similar homes in the area
Home Values in the Area
Average Home Value in this Area
Purchase History
| Date | Buyer | Sale Price | Title Company |
|---|---|---|---|
| American Residential Leasing Company Llc | -- | Alamo | |
| American Residential Properties Op Lp | -- | Fidelity National Title Nts | |
| Focused Real Property Solutions Llc | -- | Ort | |
| Federal National Mortgage Association | $100,900 | None Available | |
| Eng George E | -- | Fatco |
Source: Public Records
Mortgage History
| Date | Status | Borrower | Loan Amount |
|---|---|---|---|
| Previous Owner | Eng George E | $92,800 |
Source: Public Records
Tax History Compared to Growth
Tax History
| Year | Tax Paid | Tax Assessment Tax Assessment Total Assessment is a certain percentage of the fair market value that is determined by local assessors to be the total taxable value of land and additions on the property. | Land | Improvement |
|---|---|---|---|---|
| 2025 | $5,868 | $291,104 | $50,000 | $241,104 |
| 2024 | $5,868 | $304,430 | $40,000 | $264,430 |
| 2023 | $5,868 | $304,430 | $40,000 | $264,430 |
| 2022 | $4,662 | $210,190 | $30,000 | $180,190 |
| 2021 | $5,048 | $210,190 | $30,000 | $180,190 |
| 2020 | $4,804 | $198,840 | $30,000 | $168,840 |
| 2019 | $5,078 | $198,840 | $30,000 | $168,840 |
| 2018 | $4,174 | $162,730 | $30,000 | $132,730 |
| 2017 | $4,282 | $162,730 | $30,000 | $132,730 |
| 2016 | $3,440 | $130,750 | $20,000 | $110,750 |
| 2015 | $3,369 | $130,750 | $20,000 | $110,750 |
| 2014 | -- | $124,650 | $20,000 | $104,650 |
Source: Public Records
Map
Nearby Homes
- 214 Willow Creek Dr
- 1917 Windowmere Trail
- 2045 Mason Pond Dr
- 2113-A Dicey Rd
- Horseshoe Bend Rd
- 0 Adell Cir
- 2122 Louis Tr
- 2217 Lorrie Ln
- 1609 Dicey Rd
- 309 De la Cruz St
- 905 Terry Trail
- 509 Sweetwater Dr
- 313 De la Cruz St
- 513 Waterford Park Blvd
- 517 Waterford Park Blvd
- 521 Waterford Park Blvd
- 516 Waterford Park Blvd
- 522 Crow Ave
- 520 Waterford Park Blvd
- 541 Waterford Park Blvd
- 206 Willow Creek Dr
- 210 Willow Creek Dr
- 210 Willow Creek Dr Unit DRIVE
- 202 Willow Creek Dr
- 202 Willow Creek Dr Unit DRIVE
- 150 Willow Creek Dr
- 150 Willow Creek Dr Unit 103
- 150 Willow Creek Dr Unit 107
- 150 Willow Creek Dr Unit 101
- 201 Willow Creek Dr
- 205 Willow Creek Dr
- 218 Willow Creek Dr
- 209 Willow Creek Dr
- 1941 Windowmere Trail
- 202 Whispering Dell Ln
- 206 Whispering Dell Ln
- 213 Willow Creek Dr
- 210 Whispering Dell Ln
- 1937 Windowmere Trail
- 214 Whispering Dell Ln