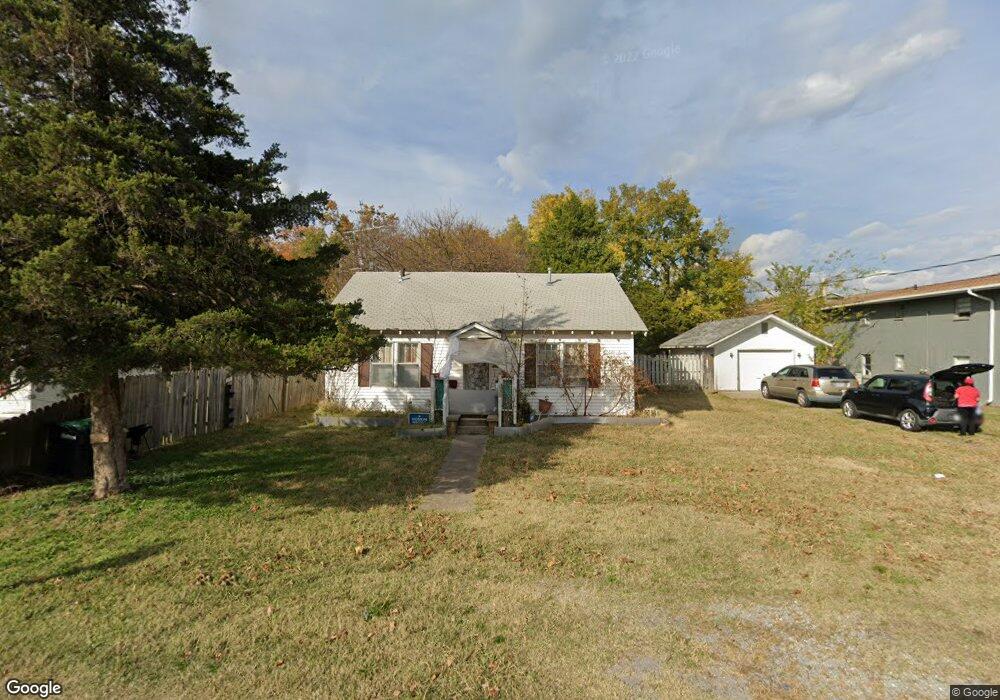
206 York St Tahlequah, OK 74464
Estimated Value: $102,000 - $121,000
3
Beds
1
Bath
1,128
Sq Ft
$102/Sq Ft
Est. Value
About This Home
This home is located at 206 York St, Tahlequah, OK 74464 and is currently estimated at $114,667, approximately $101 per square foot. 206 York St is a home located in Cherokee County with nearby schools including Cherokee Elementary School, Greenwood Elementary School, and Tahlequah Middle School.
Ownership History
Date
Name
Owned For
Owner Type
Purchase Details
Closed on
Dec 27, 2018
Sold by
Tower Real Estate Investments Llc
Bought by
Trei Holdings Llc
Current Estimated Value
Purchase Details
Closed on
May 21, 2010
Sold by
Noy Mary Louise Van and Noy Lawrence W Van
Bought by
Tower Real Estate Investments Llc
Purchase Details
Closed on
May 19, 2010
Sold by
Sutherland Glenn F and Sutherland Teresa Mayhew
Bought by
Tower Real Estate Investments Llc
Purchase Details
Closed on
Mar 1, 2008
Sold by
Wright Scott and Wright Tommye Sue
Bought by
Sutherland Glenn F and Noy Mary Louis Van
Purchase Details
Closed on
May 30, 2003
Sold by
Joe Enlow
Bought by
Irene Enlow
Purchase Details
Closed on
Jun 26, 2001
Sold by
Billie and Barbara Benton
Bought by
Scott and Tommy Wright
Create a Home Valuation Report for This Property
The Home Valuation Report is an in-depth analysis detailing your home's value as well as a comparison with similar homes in the area
Home Values in the Area
Average Home Value in this Area
Purchase History
| Date | Buyer | Sale Price | Title Company |
|---|---|---|---|
| Trei Holdings Llc | -- | None Available | |
| Tower Real Estate Investments Llc | $52,000 | None Available | |
| Tower Real Estate Investments Llc | $52,000 | None Available | |
| Sutherland Glenn F | $40,000 | Tahlequah Abstract Closing S | |
| Irene Enlow | -- | -- | |
| Scott | $15,000 | -- |
Source: Public Records
Tax History Compared to Growth
Tax History
| Year | Tax Paid | Tax Assessment Tax Assessment Total Assessment is a certain percentage of the fair market value that is determined by local assessors to be the total taxable value of land and additions on the property. | Land | Improvement |
|---|---|---|---|---|
| 2025 | $471 | $4,756 | $832 | $3,924 |
| 2024 | $471 | $4,968 | $832 | $4,136 |
| 2023 | $471 | $6,135 | $1,150 | $4,985 |
| 2022 | $569 | $6,135 | $1,150 | $4,985 |
| 2021 | $571 | $6,135 | $1,150 | $4,985 |
| 2020 | $582 | $6,135 | $1,150 | $4,985 |
| 2019 | $576 | $6,135 | $1,150 | $4,985 |
| 2018 | $583 | $6,135 | $1,150 | $4,985 |
| 2017 | $582 | $6,135 | $1,150 | $4,985 |
| 2016 | $586 | $6,135 | $1,150 | $4,985 |
| 2015 | $538 | $5,988 | $1,150 | $4,838 |
| 2014 | $538 | $5,720 | $550 | $5,170 |
Source: Public Records
Map
Nearby Homes
- 310 York St
- 916 Coy Ave
- 2020 N Everly Dr
- 2021 N Everly Dr
- 2000 N Everly Dr
- 1930 N Everly Dr
- 2010 N Everly Dr
- 2030 N Everly Dr
- 2031 N Everly Dr
- 2040 N Everly Dr
- 402 Minor St
- 702 N Jones Ave
- 615 Russell Ave
- 1108 N Jones Ave
- 1406 Skipper Ave
- 1408 Trimble Ave
- 1325 N Vinita Ave
- 317 W Morgan St
- 112 W Allen Rd
- 425 E Seneca St