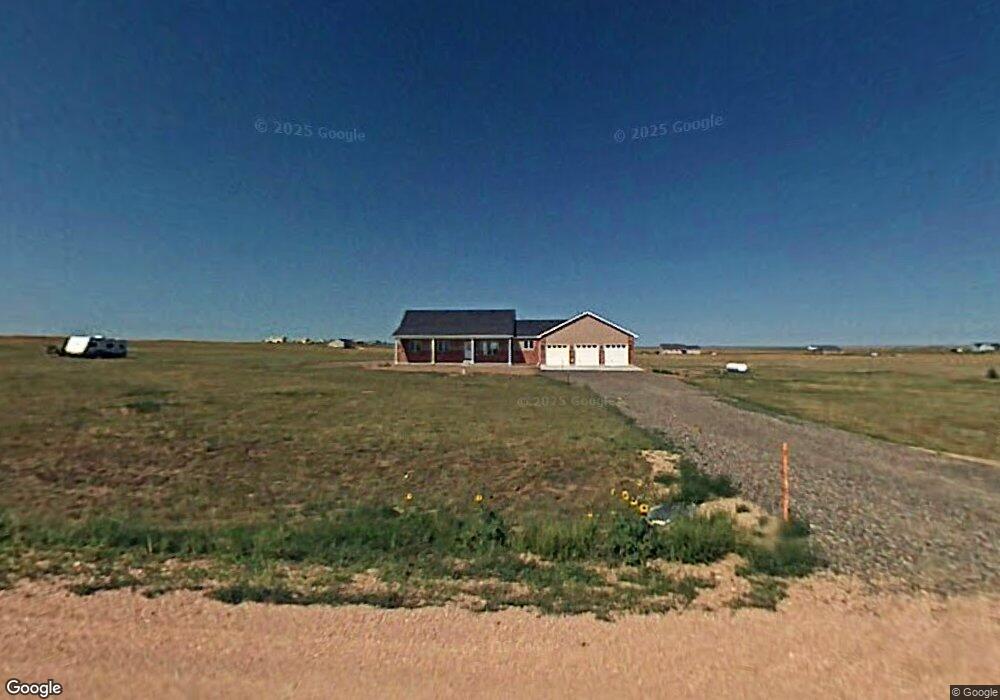
2060 Canyon Dr Cheyenne, WY 82009
Estimated Value: $491,000 - $637,815
3
Beds
2
Baths
1,660
Sq Ft
$352/Sq Ft
Est. Value
About This Home
This home is located at 2060 Canyon Dr, Cheyenne, WY 82009 and is currently estimated at $584,938, approximately $352 per square foot. 2060 Canyon Dr is a home located in Laramie County with nearby schools including Prairie Wind Elementary School, McCormick Junior High School, and Central High School.
Ownership History
Date
Name
Owned For
Owner Type
Purchase Details
Closed on
Apr 25, 2019
Sold by
Weaver Barry A and Weaver Nancy B
Bought by
Robison Matthew D and Cassel Ashley Z
Current Estimated Value
Home Financials for this Owner
Home Financials are based on the most recent Mortgage that was taken out on this home.
Original Mortgage
$357,000
Outstanding Balance
$313,866
Interest Rate
4.3%
Mortgage Type
New Conventional
Estimated Equity
$271,072
Purchase Details
Closed on
Apr 15, 2015
Sold by
Weaver Barry A and Weaver Nancy B
Bought by
Weaver Barry A and Weaver Nancy B
Purchase Details
Closed on
Apr 10, 2012
Sold by
Malory Joseph W
Bought by
Weaver Barry A and Weaver Nancy B
Purchase Details
Closed on
Aug 24, 2007
Sold by
Jeffco Construction Inc
Bought by
Malory Joseph W
Home Financials for this Owner
Home Financials are based on the most recent Mortgage that was taken out on this home.
Original Mortgage
$331,000
Interest Rate
6.69%
Mortgage Type
Purchase Money Mortgage
Create a Home Valuation Report for This Property
The Home Valuation Report is an in-depth analysis detailing your home's value as well as a comparison with similar homes in the area
Home Values in the Area
Average Home Value in this Area
Purchase History
| Date | Buyer | Sale Price | Title Company |
|---|---|---|---|
| Robison Matthew D | -- | First American | |
| Weaver Barry A | -- | None Available | |
| Weaver Barry A | -- | None Available | |
| Malory Joseph W | -- | None Available |
Source: Public Records
Mortgage History
| Date | Status | Borrower | Loan Amount |
|---|---|---|---|
| Open | Robison Matthew D | $357,000 | |
| Previous Owner | Malory Joseph W | $331,000 |
Source: Public Records
Tax History Compared to Growth
Tax History
| Year | Tax Paid | Tax Assessment Tax Assessment Total Assessment is a certain percentage of the fair market value that is determined by local assessors to be the total taxable value of land and additions on the property. | Land | Improvement |
|---|---|---|---|---|
| 2025 | $3,073 | $35,756 | $5,183 | $30,573 |
| 2024 | $3,073 | $45,722 | $6,911 | $38,811 |
| 2023 | $2,917 | $44,396 | $6,911 | $37,485 |
| 2022 | $2,675 | $39,814 | $6,413 | $33,401 |
| 2021 | $2,672 | $39,685 | $5,676 | $34,009 |
| 2020 | $2,546 | $37,924 | $5,676 | $32,248 |
| 2019 | $2,407 | $35,814 | $5,367 | $30,447 |
| 2018 | $2,036 | $33,607 | $5,367 | $28,240 |
| 2017 | $1,997 | $32,730 | $5,367 | $27,363 |
| 2016 | $1,799 | $29,777 | $3,444 | $26,333 |
| 2015 | $1,822 | $30,096 | $3,444 | $26,652 |
| 2014 | $1,827 | $29,997 | $3,325 | $26,672 |
Source: Public Records
Map
Nearby Homes
- 2076 Lacy Dr
- Tract 3 Mugho Rd
- 2245 Rainbow Ridge
- 2076 Painted Sky Rd
- TRACT 14 Old Faithful Way
- 2390 Old Faithful Way
- Lot 19 Old Faithful Way
- 2387 Silver Gate Way
- 2309 Silver Gate Way
- 2269 Carina Ct
- Tract 7 Susie Ct
- Lot 9 Sunrise Hills Dr
- TBD Road 217
- Lot 21 Telephone Rd
- Tract 5 Jk Trail
- Tract 1 Klipstein Rd
- Tract 17 Old Faithful Way
- Tract 16 Old Faithful Way
- Tract 2 Road 215
- Tract 39 Wineglass Rd
- 2066 Canyon Dr
- 2054 Canyon Dr
- 2053 Canyon Dr
- 2059 Canyon Dr
- 2067 Canyon Dr
- 2074 Canyon Dr
- 2049 Canyon Dr
- 2335 Coulter Dr
- 2075 Canyon Dr
- 2326 Coulter Dr
- 2082 Canyon Dr
- 2329 Coulter Dr
- 2067 Mammoth Rd
- 2083 Canyon Dr
- 2353 Coulter Dr
- 2060 Geyser Rd
- 2075 Mammoth Rd
- 2323 Coulter Dr
- 2044 Canyon Dr
- 2035 Canyon Dr