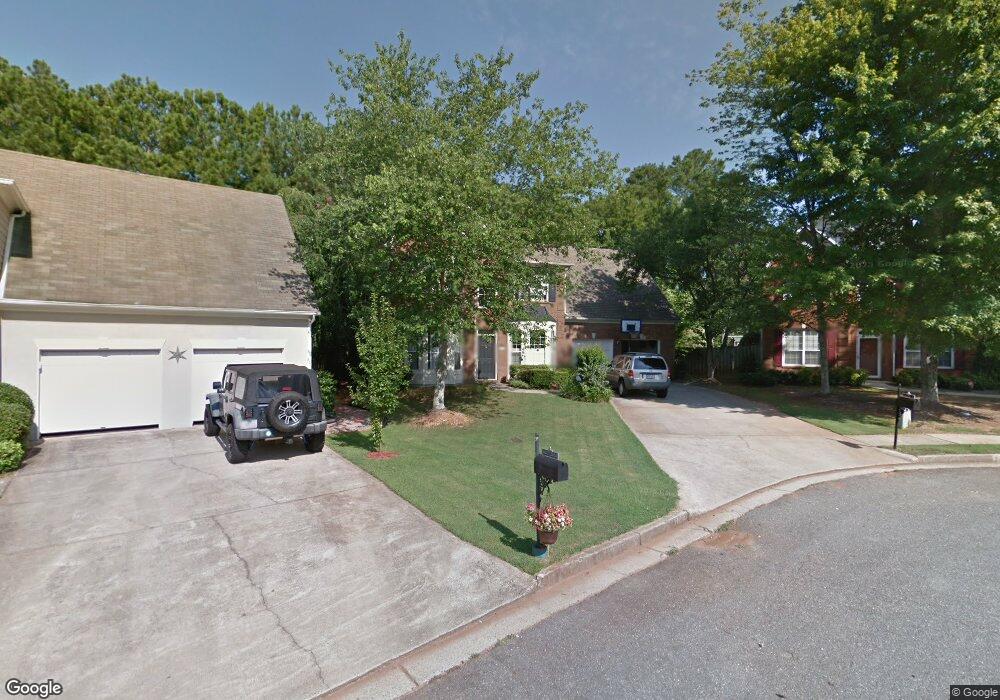
2060 Crabapple Parc Way Roswell, GA 30076
Estimated Value: $553,000 - $588,840
3
Beds
3
Baths
2,264
Sq Ft
$253/Sq Ft
Est. Value
About This Home
This home is located at 2060 Crabapple Parc Way, Roswell, GA 30076 and is currently estimated at $572,960, approximately $253 per square foot. 2060 Crabapple Parc Way is a home located in Fulton County with nearby schools including Sweet Apple Elementary School, Elkins Pointe Middle School, and Milton High School.
Ownership History
Date
Name
Owned For
Owner Type
Purchase Details
Closed on
Aug 31, 2007
Sold by
Haigh Adam and Haigh Lisa K
Bought by
Mayer Christian P
Current Estimated Value
Home Financials for this Owner
Home Financials are based on the most recent Mortgage that was taken out on this home.
Original Mortgage
$271,500
Outstanding Balance
$172,599
Interest Rate
6.65%
Mortgage Type
New Conventional
Estimated Equity
$400,361
Purchase Details
Closed on
Jun 28, 2002
Sold by
Lee Bobby J
Bought by
Haigh Adam and Haigh Lisa K
Home Financials for this Owner
Home Financials are based on the most recent Mortgage that was taken out on this home.
Original Mortgage
$184,000
Interest Rate
6.79%
Mortgage Type
New Conventional
Purchase Details
Closed on
Aug 29, 1994
Sold by
Torrey S G Atlanta Ltd
Bought by
Lee Bobby J Melanie D
Home Financials for this Owner
Home Financials are based on the most recent Mortgage that was taken out on this home.
Original Mortgage
$144,650
Interest Rate
8.37%
Create a Home Valuation Report for This Property
The Home Valuation Report is an in-depth analysis detailing your home's value as well as a comparison with similar homes in the area
Home Values in the Area
Average Home Value in this Area
Purchase History
| Date | Buyer | Sale Price | Title Company |
|---|---|---|---|
| Mayer Christian P | $271,500 | -- | |
| Haigh Adam | $230,000 | -- | |
| Lee Bobby J Melanie D | $152,300 | -- |
Source: Public Records
Mortgage History
| Date | Status | Borrower | Loan Amount |
|---|---|---|---|
| Open | Mayer Christian P | $271,500 | |
| Previous Owner | Haigh Adam | $184,000 | |
| Previous Owner | Lee Bobby J Melanie D | $144,650 |
Source: Public Records
Tax History Compared to Growth
Tax History
| Year | Tax Paid | Tax Assessment Tax Assessment Total Assessment is a certain percentage of the fair market value that is determined by local assessors to be the total taxable value of land and additions on the property. | Land | Improvement |
|---|---|---|---|---|
| 2025 | $576 | $205,960 | $62,640 | $143,320 |
| 2023 | $5,953 | $210,920 | $66,280 | $144,640 |
| 2022 | $2,335 | $170,920 | $40,600 | $130,320 |
| 2021 | $2,745 | $145,520 | $31,000 | $114,520 |
| 2020 | $2,793 | $142,040 | $29,240 | $112,800 |
| 2019 | $437 | $139,520 | $28,720 | $110,800 |
| 2018 | $3,211 | $136,240 | $28,040 | $108,200 |
| 2017 | $2,045 | $82,040 | $20,320 | $61,720 |
| 2016 | $2,044 | $82,040 | $20,320 | $61,720 |
| 2015 | $2,499 | $82,040 | $20,320 | $61,720 |
| 2014 | $2,124 | $82,040 | $20,320 | $61,720 |
Source: Public Records
Map
Nearby Homes
- 2230 Ashton Dr
- 4404 Orchard Trace
- 1115 Primrose Dr
- 406 Sweet Apple Cir
- 530 Camber Woods Dr
- 640 Mae Ln
- 290 Rucker Rd
- 600 Rounsaville Rd
- 285 N Farm Dr
- 1040 Jordan Ln
- 410 Hamilton Park Dr
- 1565 Parkside Dr
- 666 Abbey Ct
- 11625 Northgate Way
- 105 Kensington Pond Ct
- 515 Kent Rd
- 161 Brook Ln
- 300 Saddle Creek Ln
- 2070 Crabapple Parc Way
- 2050 Crabapple Parc Way
- 2040 Crabapple Parc Way
- 2410 Ashton Dr
- 2420 Ashton Dr
- 2400 Ashton Dr Unit 2
- 2390 Ashton Dr Unit 2
- 2030 Crabapple Parc Way Unit 1
- 2065 Crabapple Parc Way
- 2045 Crabapple Parc Way
- 2055 Crabapple Parc Way
- 2380 Ashton Dr
- 2430 Ashton Dr Unit 43
- 2430 Ashton Dr
- 2035 Crabapple Parc Way
- 2370 Ashton Dr
- 2020 Crabapple Parc Way
- 2025 Crabapple Parc Way
- 2360 Ashton Dr
- 2535 Ashton Dr Unit II