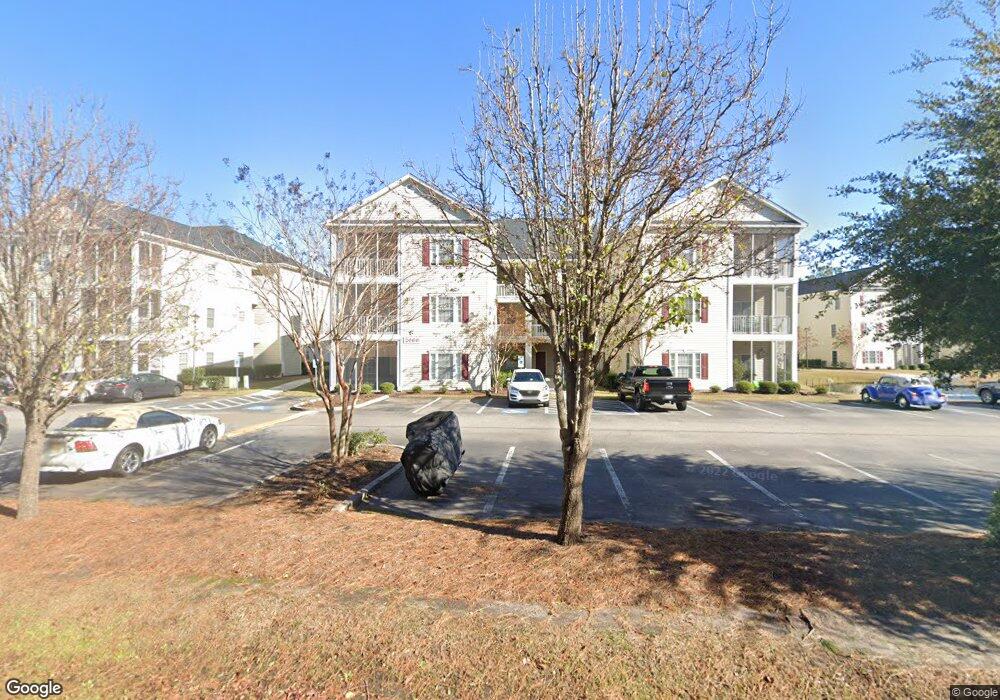
2060 Cross Gate Blvd Unit 20602 Myrtle Beach, SC 29575
Estimated Value: $206,000 - $219,000
3
Beds
2
Baths
1,343
Sq Ft
$156/Sq Ft
Est. Value
About This Home
This home is located at 2060 Cross Gate Blvd Unit 20602, Myrtle Beach, SC 29575 and is currently estimated at $210,168, approximately $156 per square foot. 2060 Cross Gate Blvd Unit 20602 is a home located in Horry County with nearby schools including Lakewood Elementary, Socastee Middle, and Socastee High School.
Ownership History
Date
Name
Owned For
Owner Type
Purchase Details
Closed on
Feb 24, 2020
Sold by
Tonery Kathleen
Bought by
Bealer Nancy E
Current Estimated Value
Home Financials for this Owner
Home Financials are based on the most recent Mortgage that was taken out on this home.
Original Mortgage
$125,400
Outstanding Balance
$111,269
Interest Rate
3.6%
Mortgage Type
New Conventional
Estimated Equity
$98,899
Purchase Details
Closed on
Sep 4, 2018
Sold by
Curpenski Richard S
Bought by
Tonery Kathleen and John
Purchase Details
Closed on
Dec 20, 2007
Sold by
Curpenski Richard S
Bought by
Curpenski Richard S and Curpenski Lynn A
Purchase Details
Closed on
Mar 1, 2006
Sold by
Smith & Smith Properties Llc
Bought by
Curpenski Richard S
Create a Home Valuation Report for This Property
The Home Valuation Report is an in-depth analysis detailing your home's value as well as a comparison with similar homes in the area
Home Values in the Area
Average Home Value in this Area
Purchase History
| Date | Buyer | Sale Price | Title Company |
|---|---|---|---|
| Bealer Nancy E | $132,000 | -- | |
| Tonery Kathleen | $117,000 | -- | |
| Curpenski Richard S | -- | Attorney | |
| Curpenski Richard S | $142,050 | None Available |
Source: Public Records
Mortgage History
| Date | Status | Borrower | Loan Amount |
|---|---|---|---|
| Open | Bealer Nancy E | $125,400 |
Source: Public Records
Tax History Compared to Growth
Tax History
| Year | Tax Paid | Tax Assessment Tax Assessment Total Assessment is a certain percentage of the fair market value that is determined by local assessors to be the total taxable value of land and additions on the property. | Land | Improvement |
|---|---|---|---|---|
| 2024 | $1,919 | $13,950 | $0 | $13,950 |
| 2023 | $1,919 | $13,850 | $0 | $13,850 |
| 2021 | $1,772 | $13,850 | $0 | $13,850 |
| 2020 | $469 | $12,810 | $0 | $12,810 |
| 2019 | $469 | $12,810 | $0 | $12,810 |
| 2018 | $0 | $8,925 | $0 | $8,925 |
| 2017 | $1,114 | $5,100 | $0 | $5,100 |
| 2016 | $0 | $5,100 | $0 | $5,100 |
| 2015 | -- | $8,925 | $0 | $8,925 |
| 2014 | $1,077 | $5,100 | $0 | $5,100 |
Source: Public Records
Map
Nearby Homes
- 2050 Cross Gate Blvd Unit 303
- 2050 Cross Gate Blvd Unit 201
- 2040 Cross Gate Blvd Unit 301
- 2020 Cross Gate Blvd Unit 203
- 2020 Cross Gate Blvd Unit 102
- 2090 Cross Gate Blvd Unit 205
- 2000 Cross Gate Blvd Unit 102
- Lot 2 Deerfield Links Dr
- Lot 1 Deerfield Links Dr
- 2170 Deerfield Ave
- 101 Maddington Place Dr Unit 103
- 1950 Bent Grass Dr Unit C
- 1943 Bent Grass Dr Unit H
- 315 N Reindeer Rd
- 455 Deerfield Links Dr
- 155 Marsh Deer Place
- 208 Sutter Dr
- 1920 Bent Grass Dr Unit 34-I
- 1920 Bent Grass Dr Unit 35-i
- 1409 Ashwood Cir
- 2060 Cross Gate Blvd Unit 305 Maddington Place
- 2060 Cross Gate Blvd Unit 302 Maddington Place
- 2060 Cross Gate Blvd Unit 305 MADDINGTON PLA
- 2060 Cross Gate Blvd Unit 204 Maddington Place
- 2060 Cross Gate Blvd
- 2060 Cross Gate Blvd Unit 301
- 2060 Cross Gate Blvd Unit 20603
- 2060 Cross Gate Blvd Unit 20603
- 2060 Cross Gate Blvd Unit 20603
- 2060 Cross Gate Blvd Unit 20603
- 2060 Cross Gate Blvd Unit 20602
- 2060 Cross Gate Blvd Unit 20602
- 2060 Cross Gate Blvd Unit 20601
- 2060 Cross Gate Blvd Unit 20601
- 2060 Cross Gate Blvd Unit 20601
- 2060 Cross Gate Blvd Unit 20601
- 2060 Cross Gate Blvd Unit 20603
- 2060 Cross Gate Blvd Unit 20602
- 2060 Cross Gate Blvd Unit 20602
- 2060 Cross Gate Blvd Unit 20601