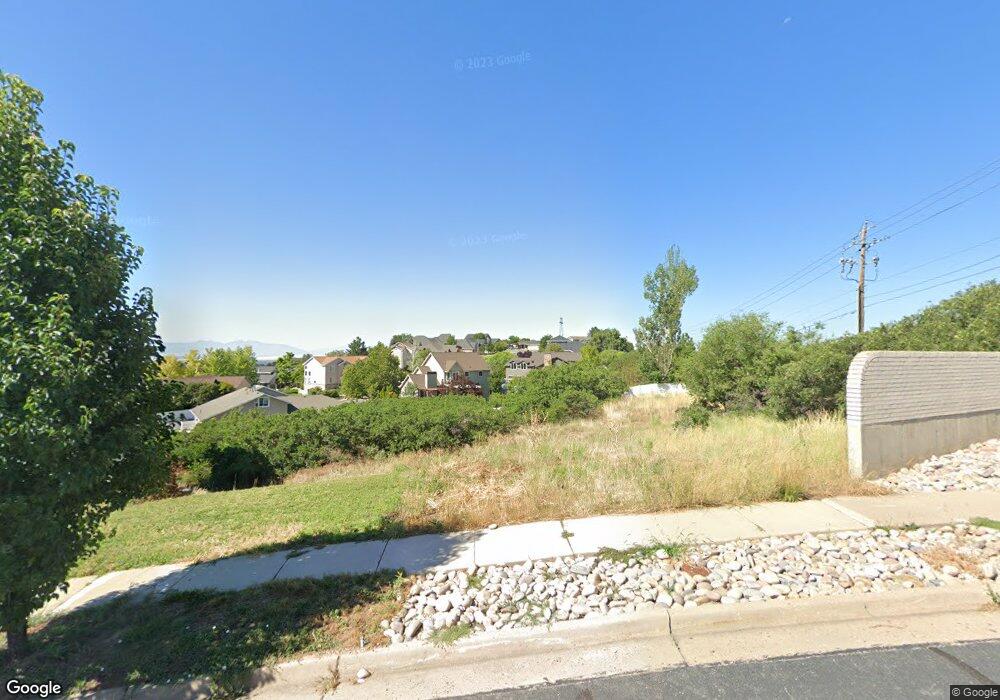
2060 E 2900 N Unit 1 Layton, UT 84040
Estimated Value: $493,000
Studio
--
Bath
--
Sq Ft
19,602
Sq Ft Lot
About This Home
This home is located at 2060 E 2900 N Unit 1, Layton, UT 84040 and is currently estimated at $493,000. 2060 E 2900 N Unit 1 is a home located in Davis County with nearby schools including Mountain View Elementary School, North Layton Junior High School, and Northridge High School.
Ownership History
Date
Name
Owned For
Owner Type
Purchase Details
Closed on
Mar 20, 2020
Sold by
Olsen James and Olsen Melanie
Bought by
Thompson Chad and Wheeler Elizabeth A
Current Estimated Value
Home Financials for this Owner
Home Financials are based on the most recent Mortgage that was taken out on this home.
Original Mortgage
$71,000
Outstanding Balance
$62,761
Interest Rate
3.4%
Mortgage Type
Seller Take Back
Estimated Equity
$430,239
Purchase Details
Closed on
Jul 31, 2013
Sold by
Simmons Carolyn
Bought by
Shields Mark
Purchase Details
Closed on
Mar 29, 2007
Sold by
Taylor Investments Lc
Bought by
Simmons Carolyn
Home Financials for this Owner
Home Financials are based on the most recent Mortgage that was taken out on this home.
Original Mortgage
$44,000
Interest Rate
6.29%
Mortgage Type
Purchase Money Mortgage
Purchase Details
Closed on
Mar 10, 2000
Sold by
Webber Judy G and Webber Richard M
Bought by
Taylor Investments Lc
Purchase Details
Closed on
Sep 9, 1999
Sold by
Webber Richard M
Bought by
Webber Judy G and Webber Richard M
Create a Home Valuation Report for This Property
The Home Valuation Report is an in-depth analysis detailing your home's value as well as a comparison with similar homes in the area
Home Values in the Area
Average Home Value in this Area
Purchase History
| Date | Buyer | Sale Price | Title Company |
|---|---|---|---|
| Thompson Chad | -- | First American Title | |
| Shields Mark | -- | Title One Inc | |
| Simmons Carolyn | -- | Equity Title Ins Agency Inc | |
| Taylor Investments Lc | -- | -- | |
| Webber Judy G | -- | Equity Title Agency |
Source: Public Records
Mortgage History
| Date | Status | Borrower | Loan Amount |
|---|---|---|---|
| Open | Thompson Chad | $71,000 | |
| Previous Owner | Simmons Carolyn | $44,000 |
Source: Public Records
Tax History
| Year | Tax Paid | Tax Assessment Tax Assessment Total Assessment is a certain percentage of the fair market value that is determined by local assessors to be the total taxable value of land and additions on the property. | Land | Improvement |
|---|---|---|---|---|
| 2025 | $1,529 | $127,034 | $127,034 | $0 |
| 2024 | $1,566 | $75,048 | $75,048 | $0 |
| 2023 | $1,147 | $51,351 | $51,351 | $0 |
| 2022 | $1,134 | $92,266 | $92,266 | $0 |
| 2021 | $1,143 | $78,308 | $78,308 | $0 |
| 2020 | $1,053 | $67,864 | $67,864 | $0 |
| 2019 | $945 | $59,636 | $59,636 | $0 |
| 2018 | $775 | $47,484 | $47,484 | $0 |
| 2016 | $616 | $37,041 | $37,041 | $0 |
| 2015 | $639 | $37,041 | $37,041 | $0 |
| 2014 | $592 | $37,041 | $37,041 | $0 |
| 2013 | -- | $42,526 | $42,526 | $0 |
Source: Public Records
Map
Nearby Homes
- 1935 Deere Valley Dr
- 3232 N Redtail Way
- 1821 E Whitetail Way
- 1827 E Whitetail Dr
- 2353 Canyon View Dr
- 1731 E 2825 N
- 2826 N 1600 E
- 2597 N 2300 E
- 3176 N 1450 E
- 1447 E 2700 N
- 3142 E Thorley Dr
- 2340 N 2050 E
- 2273 N 1975 E
- 1321 E 3125 N
- 1266 E 3125 N
- 2189 N 1950 E
- 1241 E 3075 N
- 2202 N 2300 E
- 1444 E 2400 N
- 2563 E 2250 N
- 2060 E 2900 N
- 2068 E 2900 N
- 2078 E 2900 N
- 2035 Deere View Dr
- 2021 Deere View Dr
- 2053 Deere View Dr
- 2090 E 2900 N
- 2090 E 2900 N Unit 57
- 2077 E 2900 N Unit 301
- 2071 Deere View Dr
- 2102 E 2900 N
- 2089 N 2900 E
- 2089 N 2900 E Unit 2
- 2003 Deere View Dr
- 2110 E 2900 N
- 2093 Deere View Dr
- 2093 Deere View Dr Unit 301
- 2091 E 2900 N Unit 302
- 2038 Deere View Dr
- 2120 E 2900 N
Your Personal Tour Guide
Ask me questions while you tour the home.