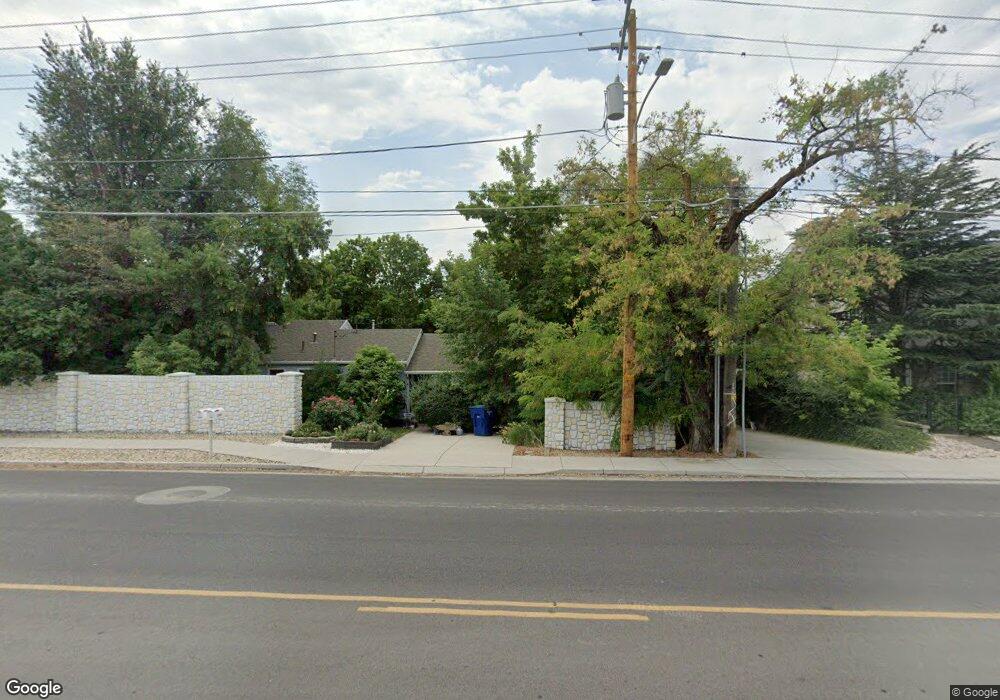
2060 E Murray Holladay Rd Salt Lake City, UT 84117
Estimated Value: $608,018 - $739,000
3
Beds
2
Baths
1,449
Sq Ft
$464/Sq Ft
Est. Value
About This Home
This home is located at 2060 E Murray Holladay Rd, Salt Lake City, UT 84117 and is currently estimated at $673,005, approximately $464 per square foot. 2060 E Murray Holladay Rd is a home located in Salt Lake County with nearby schools including Cottonwood Elementary School, Olympus Junior High School, and Olympus High School.
Ownership History
Date
Name
Owned For
Owner Type
Purchase Details
Closed on
Mar 4, 2022
Sold by
Cindy Taylor Deanna
Bought by
Deanna Cindy Taylor Trust
Current Estimated Value
Purchase Details
Closed on
Jun 22, 2017
Sold by
Holladay 2060 Llc
Bought by
Taylor Deanna Cindy
Home Financials for this Owner
Home Financials are based on the most recent Mortgage that was taken out on this home.
Original Mortgage
$214,900
Interest Rate
4.05%
Mortgage Type
New Conventional
Purchase Details
Closed on
May 30, 2008
Sold by
Livingston Roger L and Andrews Alisa
Bought by
Holladay 2060 Llc
Purchase Details
Closed on
Nov 30, 2004
Sold by
Tumblin Stephen M
Bought by
Livingston Roger L and Andrews Alisa
Home Financials for this Owner
Home Financials are based on the most recent Mortgage that was taken out on this home.
Original Mortgage
$107,500
Interest Rate
5.65%
Mortgage Type
Unknown
Create a Home Valuation Report for This Property
The Home Valuation Report is an in-depth analysis detailing your home's value as well as a comparison with similar homes in the area
Home Values in the Area
Average Home Value in this Area
Purchase History
| Date | Buyer | Sale Price | Title Company |
|---|---|---|---|
| Deanna Cindy Taylor Trust | -- | None Listed On Document | |
| Taylor Deanna Cindy | -- | Gt Title Services | |
| Holladay 2060 Llc | -- | Gt Title Services Slc | |
| Livingston Roger L | -- | Superior Title |
Source: Public Records
Mortgage History
| Date | Status | Borrower | Loan Amount |
|---|---|---|---|
| Previous Owner | Taylor Deanna Cindy | $214,900 | |
| Previous Owner | Livingston Roger L | $107,500 |
Source: Public Records
Tax History Compared to Growth
Tax History
| Year | Tax Paid | Tax Assessment Tax Assessment Total Assessment is a certain percentage of the fair market value that is determined by local assessors to be the total taxable value of land and additions on the property. | Land | Improvement |
|---|---|---|---|---|
| 2025 | $2,995 | $576,500 | $344,500 | $232,000 |
| 2024 | $2,995 | $542,100 | $333,900 | $208,200 |
| 2023 | $2,645 | $466,500 | $300,700 | $165,800 |
| 2022 | $2,761 | $489,300 | $294,800 | $194,500 |
| 2021 | $2,559 | $393,900 | $260,400 | $133,500 |
| 2020 | $2,375 | $362,500 | $257,500 | $105,000 |
| 2019 | $2,324 | $345,500 | $241,800 | $103,700 |
| 2018 | $2,448 | $333,000 | $241,800 | $91,200 |
| 2017 | $1,796 | $272,600 | $235,900 | $36,700 |
| 2016 | $1,683 | $256,900 | $235,900 | $21,000 |
| 2015 | $2,010 | $286,200 | $242,600 | $43,600 |
| 2014 | $1,909 | $267,500 | $224,800 | $42,700 |
Source: Public Records
Map
Nearby Homes
- 1968 E Sycamore Ln
- 4797 S 2124 E Unit 18D
- 1920 E Rodeo Walk Dr Unit 510
- 1920 E Rodeo Walk Dr Unit 508
- 4656 S Nathan Cir
- 2220 E Murray Holladay Rd#146 S
- 2220 E Murray Holladay Rd Unit 18
- 2220 E Murray Holladay Rd Unit 122
- 2220 E Murray Holladay Rd Unit 38
- 2220 E Murray Holladay Rd Unit 322
- 2220 E Murray Holladay Rd Unit 405
- 2220 E Murray Holladay Rd Unit 109
- 2220 E Murray Holladay Rd Unit 75
- 2220 E Murray Holladay Rd Unit 184
- 2220 E Murray Holladay Rd Unit 156
- 2250 Murray Holladay Rd Unit 301
- 2250 Murray Holladay Rd Unit 201
- 2250 Murray Holladay Rd Unit 302
- 2250 E Murray Holladay Rd Unit 303
- 2250 E Murray Holladay Rd Unit 205
- 2060 Murray Holladay Rd
- 2070 Murray Holladay Rd
- 2073 E Murray Holladay Rd
- 2061 E Murray Holladay Rd
- 2071 E Murray Holladay Rd
- 2071 Murray Holladay Rd Unit 2073
- 2051 Murray Holladay Rd
- 4786 Viewmont St
- 4786 S Viewmont St
- 2091 E Murray Holladay Rd
- 2089 Country Pine Cove
- 2089 E Country Pine Cove
- 2099 Country Pine Cove
- 2091 E 4800 S
- 2099 E Country Pine Cove
- 4847 S Memory Ln Unit 4849
- 2060 E Delmont Dr
- 2091 E Murray Holladay Rd
- 2060 Delmont Dr
- 2050 Delmont Dr