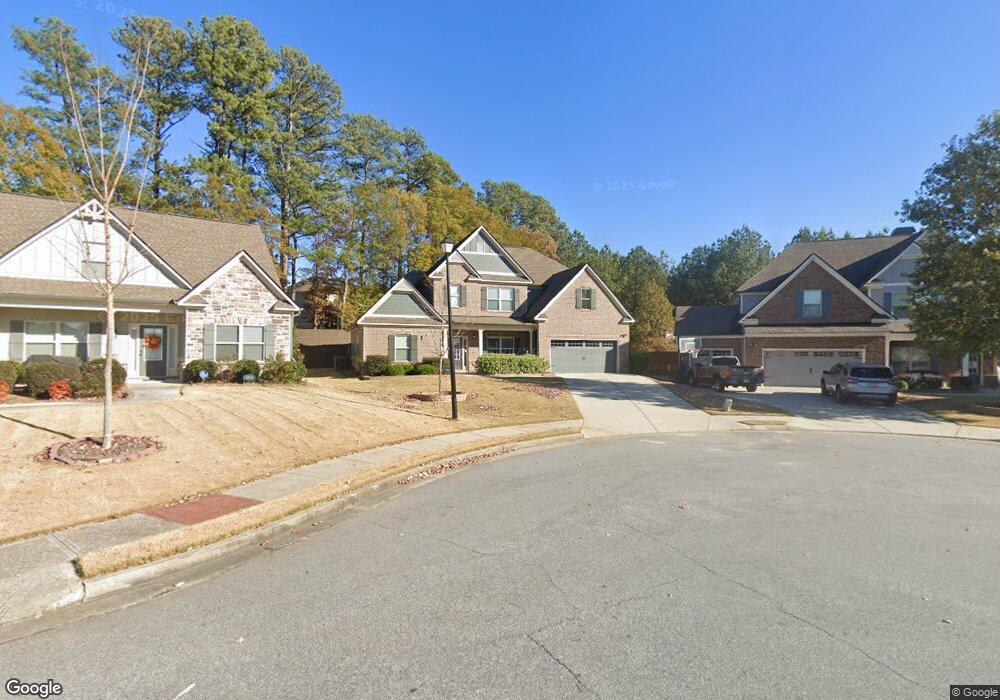
2060 Marlborough Dr Unit 48 Bethlehem, GA 30620
Estimated Value: $576,976 - $595,000
4
Beds
3
Baths
2,351
Sq Ft
$248/Sq Ft
Est. Value
About This Home
This home is located at 2060 Marlborough Dr Unit 48, Bethlehem, GA 30620 and is currently estimated at $582,494, approximately $247 per square foot. 2060 Marlborough Dr Unit 48 is a home located in Gwinnett County with nearby schools including Harbins Elementary School, McConnell Middle School, and Archer High School.
Ownership History
Date
Name
Owned For
Owner Type
Purchase Details
Closed on
Mar 15, 2024
Sold by
Espinoza Ernesto Armas
Bought by
Wilson Marquan
Current Estimated Value
Purchase Details
Closed on
Mar 24, 2022
Sold by
Fleming Rebecca
Bought by
Espinoza Ernesto Armas
Home Financials for this Owner
Home Financials are based on the most recent Mortgage that was taken out on this home.
Original Mortgage
$475,000
Interest Rate
3.89%
Mortgage Type
New Conventional
Purchase Details
Closed on
Nov 16, 2017
Sold by
Gc Reliant Homes Llc
Bought by
Fleming David and Fleming Rebecca
Home Financials for this Owner
Home Financials are based on the most recent Mortgage that was taken out on this home.
Original Mortgage
$272,070
Interest Rate
3.88%
Mortgage Type
New Conventional
Purchase Details
Closed on
Jul 1, 2015
Sold by
Gasg Lot Acquisition Fund Iii Lp
Bought by
Gc Reliant Homes Llc
Create a Home Valuation Report for This Property
The Home Valuation Report is an in-depth analysis detailing your home's value as well as a comparison with similar homes in the area
Home Values in the Area
Average Home Value in this Area
Purchase History
| Date | Buyer | Sale Price | Title Company |
|---|---|---|---|
| Wilson Marquan | $601,000 | -- | |
| Espinoza Ernesto Armas | $500,000 | -- | |
| Fleming David | $302,300 | -- | |
| Gc Reliant Homes Llc | $2,144,000 | -- |
Source: Public Records
Mortgage History
| Date | Status | Borrower | Loan Amount |
|---|---|---|---|
| Previous Owner | Espinoza Ernesto Armas | $475,000 | |
| Previous Owner | Fleming David | $272,070 |
Source: Public Records
Tax History Compared to Growth
Tax History
| Year | Tax Paid | Tax Assessment Tax Assessment Total Assessment is a certain percentage of the fair market value that is determined by local assessors to be the total taxable value of land and additions on the property. | Land | Improvement |
|---|---|---|---|---|
| 2025 | $8,061 | $218,720 | $30,000 | $188,720 |
| 2024 | $6,739 | $204,280 | $30,000 | $174,280 |
| 2023 | $6,739 | $192,640 | $38,000 | $154,640 |
| 2022 | $5,108 | $158,240 | $32,800 | $125,440 |
| 2021 | $4,721 | $135,960 | $27,600 | $108,360 |
| 2020 | $4,558 | $126,960 | $25,200 | $101,760 |
| 2019 | $4,221 | $118,360 | $23,200 | $95,160 |
| 2018 | $4,085 | $115,680 | $23,200 | $92,480 |
| 2016 | $426 | $11,520 | $11,520 | $0 |
| 2015 | $429 | $11,520 | $11,520 | $0 |
| 2014 | $99 | $2,200 | $2,200 | $0 |
Source: Public Records
Map
Nearby Homes
- 2060 Marlborough Dr
- 3001 Saratoga Sky Way
- 3550 Topeka Springs Trail
- 3424 Pratt Way
- 3344 Pratt Way
- 3893 Indian Shoals Rd SE
- 3042 Lowell Rd
- 2410 Ames St
- 3685 Arden Creek Ct
- 3894 Saddle Bag Ct
- 3903 Indian Shoals Rd SE
- 3442 Flat Run Dr Unit 1
- 3442 Flat Run Dr SE
- 3617 Shoal Trail Dr SE
- Burton Plan at Bold Springs Farm
- 3287 Hall Rd
- 2536 Cadenza Cir
- 3512 Flat Run Dr Unit 2
- 2422 Snowshoe Bend
- 2050 Madison Dr
- 2050 Marlborough Dr Unit 47
- 2070 Marlborough Dr
- 2070 Marlborough Dr Unit 49
- 2040 Marlborough Dr Unit 46
- 2040 Marlborough Dr
- 2080 Marlborough Dr
- 2080 Marlborough Dr Unit 50
- 2030 Marlborough Dr
- 2030 Marlborough Dr Unit 45
- 2031 Marlborough Dr Unit 17
- 2031 Marlborough Dr
- 2081 Marlborough Dr
- 2081 Marlborough Dr Unit 17
- 2090 Madison Dr
- 2090 Madison Dr Unit 51
- 2090 Marlborough Dr
- 2090 Marlborough Dr Unit 51
- 2020 Marlborough Dr
- 2020 Marlborough Dr Unit 44