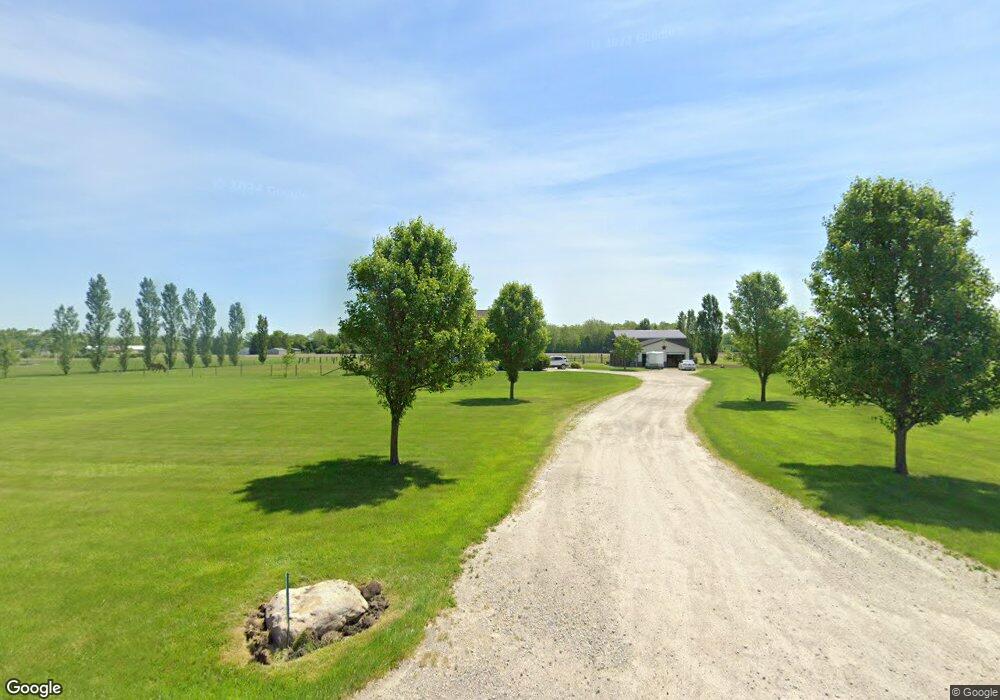
20606 Lemoyne Rd Luckey, OH 43443
Estimated Value: $353,000 - $529,339
4
Beds
3
Baths
2,916
Sq Ft
$147/Sq Ft
Est. Value
About This Home
This home is located at 20606 Lemoyne Rd, Luckey, OH 43443 and is currently estimated at $427,585, approximately $146 per square foot. 20606 Lemoyne Rd is a home located in Wood County with nearby schools including Eastwood Middle School and Eastwood High School.
Ownership History
Date
Name
Owned For
Owner Type
Purchase Details
Closed on
Mar 8, 2010
Sold by
Poling Kurt A
Bought by
Poling Korie S
Current Estimated Value
Purchase Details
Closed on
Jun 23, 2004
Sold by
Hansen James R and Hansen Judith F
Bought by
Poling Kurt A and Poling Korie S
Create a Home Valuation Report for This Property
The Home Valuation Report is an in-depth analysis detailing your home's value as well as a comparison with similar homes in the area
Purchase History
| Date | Buyer | Sale Price | Title Company |
|---|---|---|---|
| Poling Korie S | -- | Attorney | |
| Poling Kurt A | $17,500 | -- |
Source: Public Records
Tax History
| Year | Tax Paid | Tax Assessment Tax Assessment Total Assessment is a certain percentage of the fair market value that is determined by local assessors to be the total taxable value of land and additions on the property. | Land | Improvement |
|---|---|---|---|---|
| 2025 | $5,306 | $144,270 | $20,825 | $123,445 |
| 2024 | $5,252 | $144,270 | $20,825 | $123,445 |
| 2023 | $5,252 | $144,280 | $20,830 | $123,450 |
| 2021 | $4,833 | $120,160 | $16,240 | $103,920 |
| 2020 | $4,881 | $120,160 | $16,240 | $103,920 |
| 2019 | $4,298 | $100,070 | $15,580 | $84,490 |
| 2018 | $4,263 | $100,070 | $15,580 | $84,490 |
| 2017 | $1,808 | $100,070 | $15,580 | $84,490 |
| 2016 | $3,689 | $92,160 | $16,140 | $76,020 |
| 2015 | $3,689 | $87,650 | $16,140 | $71,510 |
| 2014 | $3,854 | $87,650 | $16,140 | $71,510 |
| 2013 | $4,102 | $87,650 | $16,140 | $71,510 |
Source: Public Records
Map
Nearby Homes
- 0 Lemoyne Rd Unit 10003312
- 0 Pemberville Rd
- 420 Linden Dr
- 424 Linden Dr
- 423 Linden Dr
- 449 Linden Dr
- 425 Linden Dr
- 426 Linden Dr
- 421 Linden Dr
- 451 Linden Dr
- 447 Linden Dr
- 459 Linden Dr
- 427 Linden Dr
- 443 W College Ave Unit 443
- 432 Linden St
- 214 Main St
- 428 Linden Drive (Lot 9)
- 127 Bierley Ave
- 123 Catalpa (Lot 21) Ct
- 455 Linden (Lot 42) Dr
- 20672 Lemoyne Rd
- 20531 Lemoyne Rd
- 20635 Lemoyne Rd
- 20508 Lemoyne Rd
- 20661 Lemoyne Rd
- 20681 Lemoyne Rd
- 20662 Lemoyne Rd
- 20482 Lemoyne Rd
- 20691 Lemoyne Rd
- 20757 Lemoyne Rd
- 547 Krotzer Ave Unit 3
- 549 Krotzer Ave Unit 4
- 543 Krotzer Ave Unit 2
- 20465 Lemoyne Rd
- 545 Krotzer Ave Unit 1
- 20426 Lemoyne Rd
- LOT St Rt 582 Lot 3
- LOT State Rt 582 Lot 2
- 3957 Middleton Pike
- 552 Krotzer Ave
Your Personal Tour Guide
Ask me questions while you tour the home.