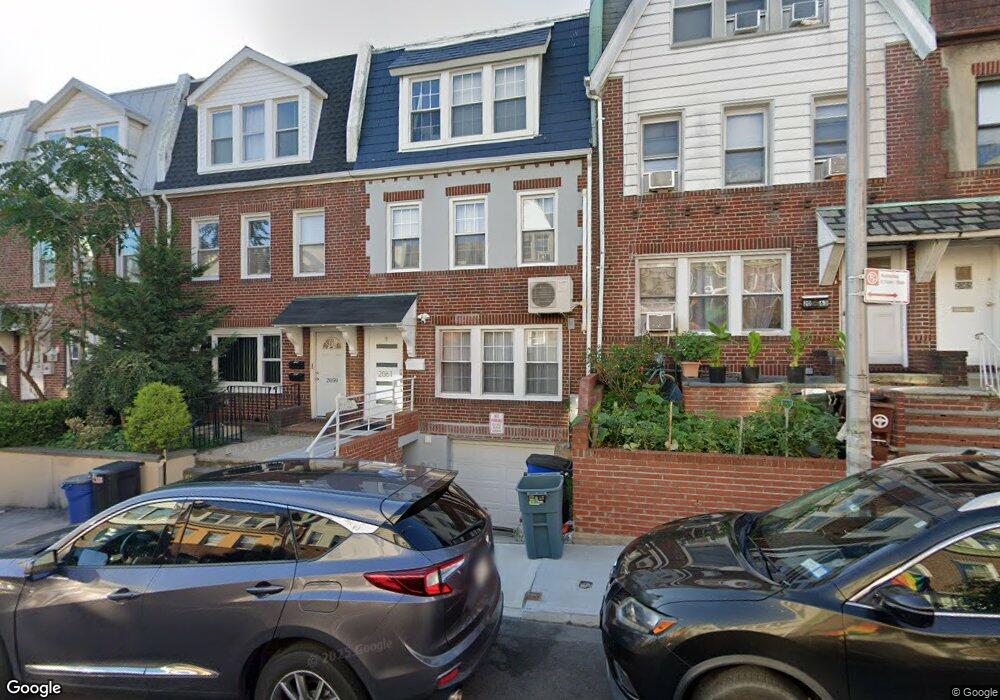
2061 32nd St Astoria, NY 11105
Ditmars Steinway NeighborhoodEstimated Value: $1,097,732 - $1,427,000
--
Bed
--
Bath
1,728
Sq Ft
$764/Sq Ft
Est. Value
About This Home
This home is located at 2061 32nd St, Astoria, NY 11105 and is currently estimated at $1,319,433, approximately $763 per square foot. 2061 32nd St is a home located in Queens County with nearby schools including P.S. 85 Judge Charles Vallone, Is 141 The Steinway, and Long Island City High School.
Ownership History
Date
Name
Owned For
Owner Type
Purchase Details
Closed on
Jan 13, 2021
Sold by
Eldar Osmanov As Trustee and Ulker Osmanov As Life Estate
Bought by
Gurung Cheme Dolker and Gurung Raju
Current Estimated Value
Home Financials for this Owner
Home Financials are based on the most recent Mortgage that was taken out on this home.
Original Mortgage
$940,000
Outstanding Balance
$834,493
Interest Rate
2.67%
Mortgage Type
Purchase Money Mortgage
Estimated Equity
$484,940
Purchase Details
Closed on
Dec 30, 2003
Sold by
Olson Sharon and Olson Osgood
Bought by
Asanova Zoulfira and Osmanov Ulker
Home Financials for this Owner
Home Financials are based on the most recent Mortgage that was taken out on this home.
Original Mortgage
$413,100
Interest Rate
5.65%
Mortgage Type
Purchase Money Mortgage
Create a Home Valuation Report for This Property
The Home Valuation Report is an in-depth analysis detailing your home's value as well as a comparison with similar homes in the area
Home Values in the Area
Average Home Value in this Area
Purchase History
| Date | Buyer | Sale Price | Title Company |
|---|---|---|---|
| Gurung Cheme Dolker | $1,175,000 | -- | |
| Gurung Cheme Dolker | $1,175,000 | -- | |
| Gurung Cheme Dolker | $1,175,000 | -- | |
| Asanova Zoulfira | $535,000 | -- | |
| Asanova Zoulfira | $535,000 | -- |
Source: Public Records
Mortgage History
| Date | Status | Borrower | Loan Amount |
|---|---|---|---|
| Open | Gurung Cheme Dolker | $940,000 | |
| Closed | Gurung Cheme Dolker | $940,000 | |
| Previous Owner | Asanova Zoulfira | $413,100 | |
| Closed | Asanova Zoulfira | $95,100 |
Source: Public Records
Tax History Compared to Growth
Tax History
| Year | Tax Paid | Tax Assessment Tax Assessment Total Assessment is a certain percentage of the fair market value that is determined by local assessors to be the total taxable value of land and additions on the property. | Land | Improvement |
|---|---|---|---|---|
| 2025 | $8,636 | $42,997 | $6,103 | $36,894 |
| 2024 | $8,636 | $42,996 | $6,672 | $36,324 |
| 2023 | $8,570 | $42,668 | $6,175 | $36,493 |
| 2022 | $8,036 | $77,520 | $10,680 | $66,840 |
| 2021 | $7,992 | $77,280 | $10,680 | $66,600 |
| 2020 | $7,584 | $77,760 | $10,680 | $67,080 |
| 2019 | $7,495 | $72,840 | $10,680 | $62,160 |
| 2018 | $7,248 | $35,557 | $6,028 | $29,529 |
| 2017 | $6,838 | $33,546 | $6,105 | $27,441 |
| 2016 | $6,327 | $33,546 | $6,105 | $27,441 |
| 2015 | $3,597 | $29,859 | $7,759 | $22,100 |
| 2014 | $3,597 | $29,859 | $8,643 | $21,216 |
Source: Public Records
Map
Nearby Homes
- 20-68 33rd St
- 21-05 33 St Unit 5F
- 21-06 35th St Unit 4-E
- 21-06 35th St Unit 3E
- 21-15 33rd St Unit 4E
- 21-15 33 St Unit 4G
- 21-16 35th St Unit 5-B
- 21-05 33rd St Unit 5-D
- 21-05 33rd St Unit 1G
- 21-16 35 Unit 1B
- 35-19 21st Ave
- 21-21 31st St Unit 4 E
- 21-28 35th St Unit 2-A
- 21-37 33rd St Unit 5-B
- 2137 33rd St Unit 3D
- 21-37 33rd St Unit 1E
- 21-38 35 St Unit 1H
- 21-38 35th St Unit 1-B
- 21-47 33rd St Unit 1B
- 21-47 33rd St Unit 5E
- 2059 32 Nd St
- 20-59 32nd St Unit 1
- 20-59 32nd St
- 2059 32nd St
- 20-57 32 Nd St Unit 3
- 20-57 32nd St Unit 3
- 2057 32nd St
- 2057 32nd St Unit 3
- 20-61 32nd St
- 2055 32nd St
- 2063 32nd St
- 20-65 32 Nd St Unit 2
- 2053 32nd St
- 20-65 32nd St Unit 1
- 20-65 32nd St Unit 2
- 2065 32nd St
- 2067 32nd St
- 2051 32nd St
- 2060 33rd St
- 2062 33rd St