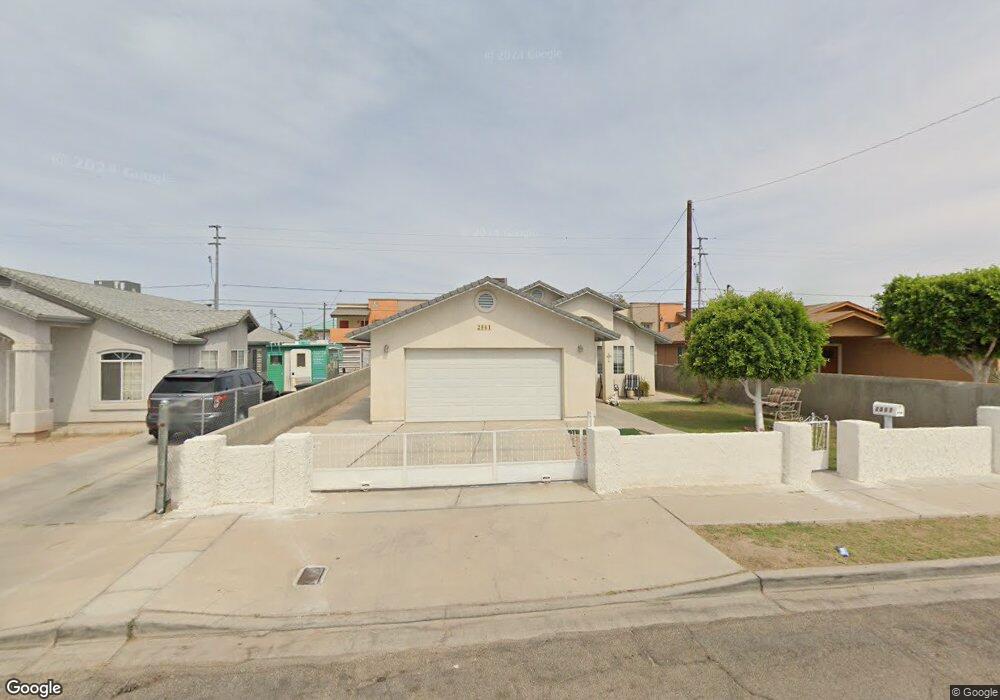
2061 S Walnut Ave Unit 3 Yuma, AZ 85364
Mesa Heights NeighborhoodEstimated Value: $226,000 - $239,000
2
Beds
1
Bath
1,225
Sq Ft
$189/Sq Ft
Est. Value
About This Home
This home is located at 2061 S Walnut Ave Unit 3, Yuma, AZ 85364 and is currently estimated at $232,049, approximately $189 per square foot. 2061 S Walnut Ave Unit 3 is a home located in Yuma County with nearby schools including C. W. McGraw Elementary School, Gila Vista Junior High School, and Yuma High School.
Ownership History
Date
Name
Owned For
Owner Type
Purchase Details
Closed on
Sep 15, 2011
Sold by
Pericos Construction Llc
Bought by
Ortiz Francisco J and Ortiz Guadalupe D
Current Estimated Value
Home Financials for this Owner
Home Financials are based on the most recent Mortgage that was taken out on this home.
Original Mortgage
$97,465
Outstanding Balance
$66,712
Interest Rate
4.25%
Mortgage Type
FHA
Estimated Equity
$165,337
Purchase Details
Closed on
Dec 16, 2010
Sold by
Galvez Manuel and Galvez Maria A
Bought by
Pericos Construction Llc
Purchase Details
Closed on
Jan 11, 2010
Sold by
Galvez Maria A and Galvez Lupe
Bought by
Galvez Manuel
Purchase Details
Closed on
Nov 24, 2003
Sold by
Navarro Irenia B and Navarro Tania
Bought by
Navarro Irenia B
Purchase Details
Closed on
Mar 5, 2001
Sold by
Gonzalez Caroline M and Peterson Ernest
Bought by
Navarro Irenia B and Navarro Tania
Create a Home Valuation Report for This Property
The Home Valuation Report is an in-depth analysis detailing your home's value as well as a comparison with similar homes in the area
Home Values in the Area
Average Home Value in this Area
Purchase History
| Date | Buyer | Sale Price | Title Company |
|---|---|---|---|
| Ortiz Francisco J | $100,000 | Chicago Title | |
| Pericos Construction Llc | -- | None Available | |
| Galvez Manuel | -- | Title Security | |
| Galvez Manuel | $28,000 | Title Security | |
| Navarro Irenia B | -- | -- | |
| Navarro Irenia B | $26,000 | Citizens Title |
Source: Public Records
Mortgage History
| Date | Status | Borrower | Loan Amount |
|---|---|---|---|
| Open | Ortiz Francisco J | $97,465 |
Source: Public Records
Tax History Compared to Growth
Tax History
| Year | Tax Paid | Tax Assessment Tax Assessment Total Assessment is a certain percentage of the fair market value that is determined by local assessors to be the total taxable value of land and additions on the property. | Land | Improvement |
|---|---|---|---|---|
| 2025 | $1,264 | $12,608 | $1,955 | $10,653 |
| 2024 | $1,241 | $12,007 | $1,865 | $10,142 |
| 2023 | $1,241 | $11,436 | $1,311 | $10,125 |
| 2022 | $1,198 | $10,891 | $1,466 | $9,425 |
| 2021 | $1,271 | $10,372 | $1,663 | $8,709 |
| 2020 | $1,161 | $9,879 | $1,742 | $8,137 |
| 2019 | $1,140 | $9,409 | $1,350 | $8,059 |
| 2018 | $1,084 | $8,961 | $1,429 | $7,532 |
| 2017 | $1,038 | $8,961 | $1,429 | $7,532 |
| 2016 | $1,014 | $8,127 | $1,043 | $7,084 |
| 2015 | $985 | $7,741 | $523 | $7,218 |
| 2014 | $985 | $7,372 | $528 | $6,844 |
Source: Public Records
Map
Nearby Homes
- 2043 S Maple Ave Unit 3
- 1872 S Walnut Ave
- 2343 S Madison Ave
- 0000 W 24th St
- 500 W 20th St
- 904 E La Mesa St
- 683 E 25th St
- 183 E 25th Place
- 256 E 26th St
- 1309 E 22nd St
- 613 E 26th St
- 927 E La Mesa St
- 0000 S Arizona Ave
- 2621 S Walnut Ave
- 1995 S 10th Ave
- 2630 S James Ave
- 1527 E 23rd St
- 2039 S 11th Ave
- 2330 E Test Listing !Dnp! Viaduct
- 1550 S 7th Ave
- 2069 S Walnut Ave
- 2053 S Walnut Ave
- 2045 S Walnut Ave
- 2071 S Walnut Ave
- 2037 S Walnut Ave
- 2081 S Walnut Ave
- 2062 S Walnut Ave
- 2058 S Walnut Ave
- 2023 S Walnut Ave
- 2089 S Walnut Ave
- 2046 S Walnut Ave
- 2044 S Walnut Ave
- 2024 S Arizona Ave
- 2040 S Walnut Ave
- 2005 S Walnut Ave
- 2105 S Walnut Ave
- 2026 S Walnut Ave
- 2061 S Maple Ave
- 2051 S Maple Ave
- 2065 S Maple Ave