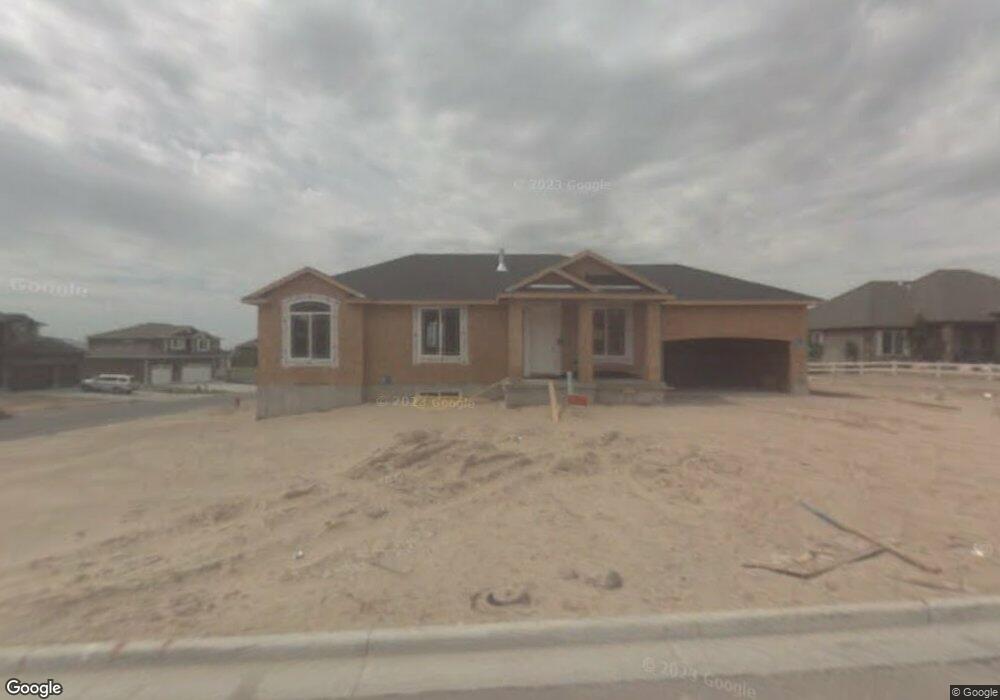
2061 Sharpshooter Ct Farmington, UT 84025
West Kaysville NeighborhoodEstimated Value: $664,000 - $704,000
5
Beds
3
Baths
3,340
Sq Ft
$205/Sq Ft
Est. Value
About This Home
This home is located at 2061 Sharpshooter Ct, Farmington, UT 84025 and is currently estimated at $683,788, approximately $204 per square foot. 2061 Sharpshooter Ct is a home located in Davis County with nearby schools including Endeavour Elementary School, Farmington High, and Centennial Junior High School.
Ownership History
Date
Name
Owned For
Owner Type
Purchase Details
Closed on
Feb 10, 2023
Sold by
West Bradley
Bought by
Guidry James K and Guidry Christina S
Current Estimated Value
Purchase Details
Closed on
Aug 25, 2016
Sold by
West Bradley and West Jennifer
Bought by
Carter Spencer
Purchase Details
Closed on
Aug 31, 2011
Sold by
Hoffman James L and Hoffman Shanti L
Bought by
Sauer Randy and Sauer Zvjezdana
Home Financials for this Owner
Home Financials are based on the most recent Mortgage that was taken out on this home.
Original Mortgage
$280,250
Interest Rate
4.46%
Mortgage Type
New Conventional
Purchase Details
Closed on
Aug 1, 2008
Sold by
Woodside Hunters Creek Llc
Bought by
Hoffman James L and Hoffman Shanti L
Home Financials for this Owner
Home Financials are based on the most recent Mortgage that was taken out on this home.
Original Mortgage
$301,854
Interest Rate
6.32%
Mortgage Type
Purchase Money Mortgage
Create a Home Valuation Report for This Property
The Home Valuation Report is an in-depth analysis detailing your home's value as well as a comparison with similar homes in the area
Home Values in the Area
Average Home Value in this Area
Purchase History
| Date | Buyer | Sale Price | Title Company |
|---|---|---|---|
| Guidry James K | -- | Fidelity National Title | |
| Carter Spencer | -- | Gt Title Services | |
| Sauer Randy | -- | First American Title | |
| Hoffman James L | -- | Us Title Company Of Utah |
Source: Public Records
Mortgage History
| Date | Status | Borrower | Loan Amount |
|---|---|---|---|
| Previous Owner | Sauer Randy | $280,250 | |
| Previous Owner | Hoffman James L | $301,854 |
Source: Public Records
Tax History Compared to Growth
Tax History
| Year | Tax Paid | Tax Assessment Tax Assessment Total Assessment is a certain percentage of the fair market value that is determined by local assessors to be the total taxable value of land and additions on the property. | Land | Improvement |
|---|---|---|---|---|
| 2024 | $3,328 | $344,849 | $149,293 | $195,556 |
| 2023 | $3,431 | $647,000 | $239,731 | $407,269 |
| 2022 | $3,498 | $361,900 | $131,562 | $230,338 |
| 2021 | $3,162 | $487,000 | $138,616 | $348,384 |
| 2020 | $2,877 | $432,000 | $133,265 | $298,735 |
| 2019 | $2,897 | $422,000 | $150,402 | $271,598 |
| 2018 | $2,710 | $389,000 | $135,759 | $253,241 |
| 2016 | $2,649 | $195,745 | $52,116 | $143,629 |
| 2015 | $2,669 | $187,110 | $52,116 | $134,994 |
| 2014 | $2,373 | $170,973 | $44,159 | $126,814 |
| 2013 | -- | $170,731 | $33,168 | $137,563 |
Source: Public Records
Map
Nearby Homes
- 1566 W Pheasant Place
- 276 E 2200 S
- 926 N 1875 W
- 2261 S 50 E
- 2274 S 50 E
- 278 E Shepard Ln
- 69 W 2200 S
- 2071 S 400 E
- 2266 S Betsys Way
- 2226 S Betsys Way
- 556 Innovator Dr Unit 158
- 1820 S Kerrybrook Dr
- 1181 Set Ct Unit 2
- 1332 N 1580 W
- 562 Innovator Dr Unit 155
- 2009 W Lonestar Dr
- 1488 W Kiera Ct Unit 148
- 1484 W Kiera Ct Unit 146
- 604 Sego Way Unit 220
- 604 Sego Way Unit 207
- 891 Sharpshooter Dr
- 2056 Sharpshooter Ct
- 2083 Sharpshooter Ct
- 894 Sharpshooter Dr
- 2088 Sharpshooter Dr
- 2068 Sharpshooter Ct
- 878 Sharpshooter Dr
- 902 Sharpshooter Dr
- 2084 Sharpshooter Ct
- 2111 Pheasant Place
- 866 Sharpshooter Dr
- 2102 Sharpshooter Dr
- 939 Sharpshooter Dr
- 2112 Pheasant Place
- 2116 Sharpshooter Dr
- 2123 Pheasant Place
- 2126 Pheasant Place
- 2126 Pheasant Place Unit 205
- 2123 Pheasant Place
- 2124 Sharpshooter Dr