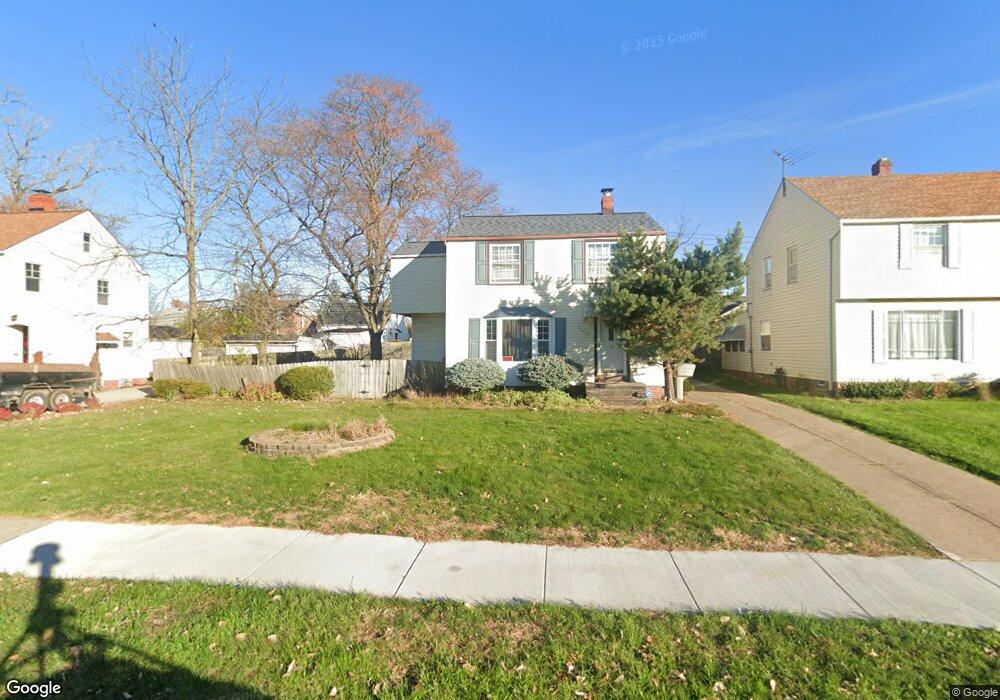
20611 Clare Ave Maple Heights, OH 44137
Estimated Value: $128,239 - $202,000
3
Beds
2
Baths
1,826
Sq Ft
$85/Sq Ft
Est. Value
About This Home
This home is located at 20611 Clare Ave, Maple Heights, OH 44137 and is currently estimated at $155,060, approximately $84 per square foot. 20611 Clare Ave is a home located in Cuyahoga County with nearby schools including Abraham Lincoln Elementary School, Rockside/ J.F. Kennedy School, and Italy High School.
Ownership History
Date
Name
Owned For
Owner Type
Purchase Details
Closed on
Oct 7, 2022
Sold by
Duncans Discount Carpet Llc
Bought by
Duncan Tina Marchelle
Current Estimated Value
Purchase Details
Closed on
Jan 20, 2021
Sold by
Magical Works Llc
Bought by
Duncans Discount Carpet Llc
Home Financials for this Owner
Home Financials are based on the most recent Mortgage that was taken out on this home.
Original Mortgage
$60,000
Interest Rate
2.6%
Mortgage Type
Credit Line Revolving
Purchase Details
Closed on
Sep 16, 2019
Sold by
Carthen Jason D and Federal National Mortgage Asso
Bought by
Magical Works Llc
Purchase Details
Closed on
Apr 30, 2019
Sold by
Foster Maurice A
Bought by
Amarhi Capital Investment Llc
Purchase Details
Closed on
Aug 24, 2018
Sold by
Carthen Jason
Bought by
Foster Maurice
Purchase Details
Closed on
Apr 13, 2012
Sold by
Carthen Jamesena C
Bought by
Carthen Jason D
Purchase Details
Closed on
Feb 9, 2004
Sold by
Carthen Jason D
Bought by
Carthen Jason D and Carthen Jamesena
Home Financials for this Owner
Home Financials are based on the most recent Mortgage that was taken out on this home.
Original Mortgage
$96,100
Interest Rate
3.54%
Mortgage Type
Negative Amortization
Purchase Details
Closed on
Mar 16, 1999
Sold by
Cabot Renovation Inc
Bought by
Carthen Jason D
Home Financials for this Owner
Home Financials are based on the most recent Mortgage that was taken out on this home.
Original Mortgage
$96,728
Interest Rate
6.8%
Mortgage Type
FHA
Purchase Details
Closed on
Jul 28, 1998
Sold by
Hud
Bought by
Cabot Renovation Inc
Home Financials for this Owner
Home Financials are based on the most recent Mortgage that was taken out on this home.
Original Mortgage
$70,400
Interest Rate
7.05%
Purchase Details
Closed on
Dec 19, 1997
Sold by
Chambliss Wayne
Bought by
Hud
Purchase Details
Closed on
Sep 21, 1990
Sold by
Mayerski Douglas E
Bought by
Chambliss Wayne
Purchase Details
Closed on
Oct 13, 1976
Sold by
Thorley Richard J and Thorley Patricia
Bought by
Mayerski Douglas E
Purchase Details
Closed on
Jan 1, 1975
Bought by
Thorley Richard J and Thorley Patricia
Create a Home Valuation Report for This Property
The Home Valuation Report is an in-depth analysis detailing your home's value as well as a comparison with similar homes in the area
Home Values in the Area
Average Home Value in this Area
Purchase History
| Date | Buyer | Sale Price | Title Company |
|---|---|---|---|
| Duncan Tina Marchelle | -- | River Title | |
| Duncans Discount Carpet Llc | $60,000 | Titleco Title Agency | |
| Magical Works Llc | $36,200 | None Available | |
| Amarhi Capital Investment Llc | -- | None Available | |
| Foster Maurice | -- | None Available | |
| Carthen Jason D | -- | None Available | |
| Carthen Jason D | -- | Renaissance Title & Escrow | |
| Carthen Jason D | $97,000 | Choice Title Agency Inc | |
| Cabot Renovation Inc | -- | Gateway Title Agency Inc | |
| Hud | $60,000 | -- | |
| Chambliss Wayne | $69,500 | -- | |
| Mayerski Douglas E | $30,600 | -- | |
| Thorley Richard J | -- | -- |
Source: Public Records
Mortgage History
| Date | Status | Borrower | Loan Amount |
|---|---|---|---|
| Previous Owner | Duncans Discount Carpet Llc | $60,000 | |
| Previous Owner | Carthen Jason D | $96,100 | |
| Previous Owner | Carthen Jason D | $96,728 | |
| Previous Owner | Cabot Renovation Inc | $70,400 | |
| Closed | Carthen Jason D | $20,000 |
Source: Public Records
Tax History Compared to Growth
Tax History
| Year | Tax Paid | Tax Assessment Tax Assessment Total Assessment is a certain percentage of the fair market value that is determined by local assessors to be the total taxable value of land and additions on the property. | Land | Improvement |
|---|---|---|---|---|
| 2024 | $3,283 | $36,505 | $6,720 | $29,785 |
| 2023 | $2,180 | $20,090 | $4,060 | $16,030 |
| 2022 | $2,219 | $20,090 | $4,060 | $16,030 |
| 2021 | $2,365 | $20,090 | $4,060 | $16,030 |
| 2020 | $2,025 | $15,230 | $3,080 | $12,150 |
| 2019 | $1,971 | $43,500 | $8,800 | $34,700 |
| 2018 | $2,610 | $15,230 | $3,080 | $12,150 |
| 2017 | $2,472 | $19,110 | $2,870 | $16,240 |
| 2016 | $2,392 | $19,110 | $2,870 | $16,240 |
| 2015 | $2,407 | $19,110 | $2,870 | $16,240 |
| 2014 | $2,407 | $21,000 | $3,150 | $17,850 |
Source: Public Records
Map
Nearby Homes
- 20510 Mountville Dr
- 20701 Kenyon Dr
- 20814 Kenyon Dr
- 20107 Libby Rd
- 20814 Watson Rd
- 20715 Watson Rd
- 19807 Gardenview Dr
- 21102 Raymond St
- 20907 Watson Rd
- 19806 Mountville Dr
- 21207 Franklin Rd
- 20120 Mccracken Rd
- 19812 Stockton Ave
- 19520 Maple Heights Blvd
- 21416 Gardenview Dr
- 19289 Stafford Ave
- 5165 Camden Rd
- 19309 Nitra Ave
- 19221 Stafford Ave
- 20625 Centuryway Rd
- 20615 Clare Ave
- 20619 Clare Ave
- 20603 Clare Ave
- 20608 Hillgrove Ave
- 20519 Clare Ave
- 20612 Hillgrove Ave
- 20604 Hillgrove Ave
- 20616 Hillgrove 3 4fb
- 20616 Hillgrove Ave
- 20600 Hillgrove Ave
- 20515 Clare Ave
- 20610 Clare Ave
- 20516 Hillgrove Ave
- 20614 Clare Ave
- 20606 Clare Ave
- 20703 Clare Ave
- 20618 Clare Ave
- 20602 Clare Ave
- 20511 Clare Ave
- 20512 Hillgrove Ave