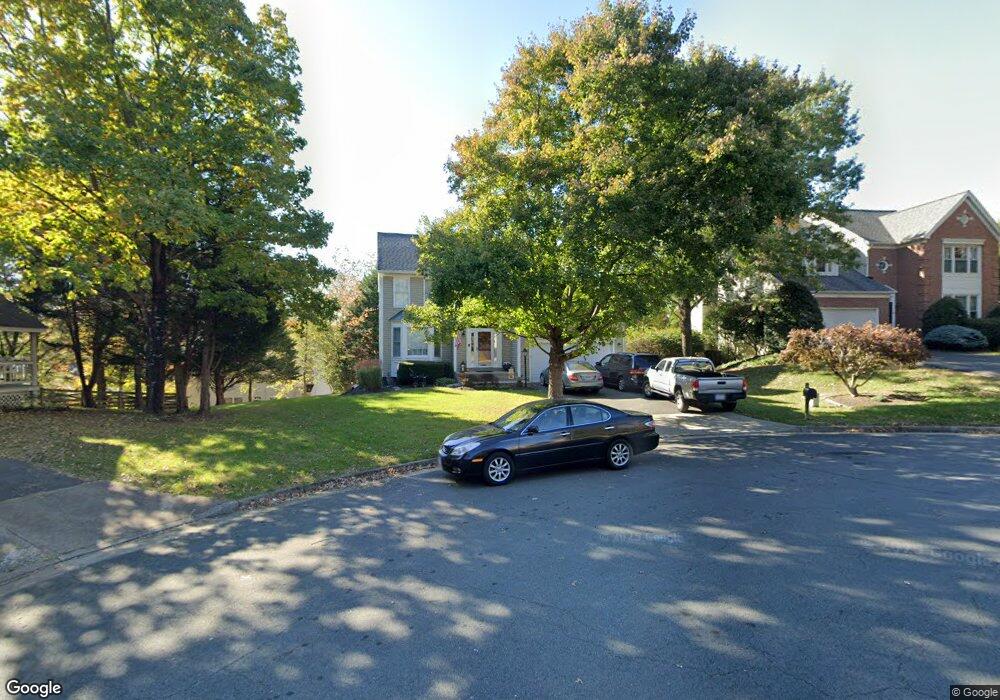
20615 Langford Ct Sterling, VA 20165
Estimated Value: $812,000 - $849,000
4
Beds
3
Baths
2,130
Sq Ft
$387/Sq Ft
Est. Value
About This Home
This home is located at 20615 Langford Ct, Sterling, VA 20165 and is currently estimated at $823,787, approximately $386 per square foot. 20615 Langford Ct is a home located in Loudoun County with nearby schools including Potowmack Elementary School, River Bend Middle School, and Potomac Falls High School.
Ownership History
Date
Name
Owned For
Owner Type
Purchase Details
Closed on
Jun 25, 1998
Sold by
Steele Newell B
Bought by
Elfers Stephen T and Elfers Peggy L
Current Estimated Value
Home Financials for this Owner
Home Financials are based on the most recent Mortgage that was taken out on this home.
Original Mortgage
$173,600
Outstanding Balance
$33,891
Interest Rate
7.09%
Mortgage Type
New Conventional
Estimated Equity
$789,896
Create a Home Valuation Report for This Property
The Home Valuation Report is an in-depth analysis detailing your home's value as well as a comparison with similar homes in the area
Home Values in the Area
Average Home Value in this Area
Purchase History
| Date | Buyer | Sale Price | Title Company |
|---|---|---|---|
| Elfers Stephen T | $217,000 | -- |
Source: Public Records
Mortgage History
| Date | Status | Borrower | Loan Amount |
|---|---|---|---|
| Open | Elfers Stephen T | $173,600 |
Source: Public Records
Tax History Compared to Growth
Tax History
| Year | Tax Paid | Tax Assessment Tax Assessment Total Assessment is a certain percentage of the fair market value that is determined by local assessors to be the total taxable value of land and additions on the property. | Land | Improvement |
|---|---|---|---|---|
| 2025 | $6,257 | $777,210 | $254,400 | $522,810 |
| 2024 | $6,304 | $728,790 | $234,400 | $494,390 |
| 2023 | $6,342 | $724,840 | $234,400 | $490,440 |
| 2022 | $6,026 | $677,060 | $229,400 | $447,660 |
| 2021 | $5,850 | $596,890 | $208,200 | $388,690 |
| 2020 | $5,883 | $568,430 | $198,200 | $370,230 |
| 2019 | $5,721 | $547,460 | $198,200 | $349,260 |
| 2018 | $5,800 | $534,580 | $188,200 | $346,380 |
| 2017 | $5,809 | $516,320 | $188,200 | $328,120 |
| 2016 | $6,038 | $527,300 | $0 | $0 |
| 2015 | $5,726 | $316,270 | $0 | $316,270 |
| 2014 | $5,749 | $309,590 | $0 | $309,590 |
Source: Public Records
Map
Nearby Homes
- 20594 Shadow Woods Ct
- 20627 Cutwater Place
- 46606 Drysdale Terrace Unit 101
- 46608 Drysdale Terrace Unit 101
- 46622 Drysdale Terrace Unit 100
- 20597 Glenmere Square
- 46685 Joubert Terrace
- 46675 Cavendish Square
- 25 Jefferson Dr
- 20419 Riverbend Square Unit 301
- 46186 Aisquith Terrace
- 46212 Wales Terrace
- 86 Sugarland Run Dr
- 46809 Trailwood Place
- 110 Sugarland Run Dr
- 105 Woodgate Ct
- 7 S Lowery Ct
- 46134 Brisbane Square
- 735 Brethour Ct Unit 4
- 20544 Morningside Terrace
- 20611 Langford Ct
- 20620 Middlecreek Ct
- 20619 Langford Ct
- 20616 Middlecreek Ct
- 20612 Middlecreek Ct
- 20607 Langford Ct
- 20624 Middlecreek Ct
- 20623 Langford Ct
- 20608 Middlecreek Ct
- 20628 Middlecreek Ct
- 20614 Langford Ct
- 20610 Langford Ct
- 46401 Woodlake Place
- 20618 Langford Ct
- 20606 Langford Ct
- 20627 Middlecreek Ct
- 20615 Middlecreek Ct
- 20623 Middlecreek Ct
- 20611 Middlecreek Ct
- 20619 Middlecreek Ct