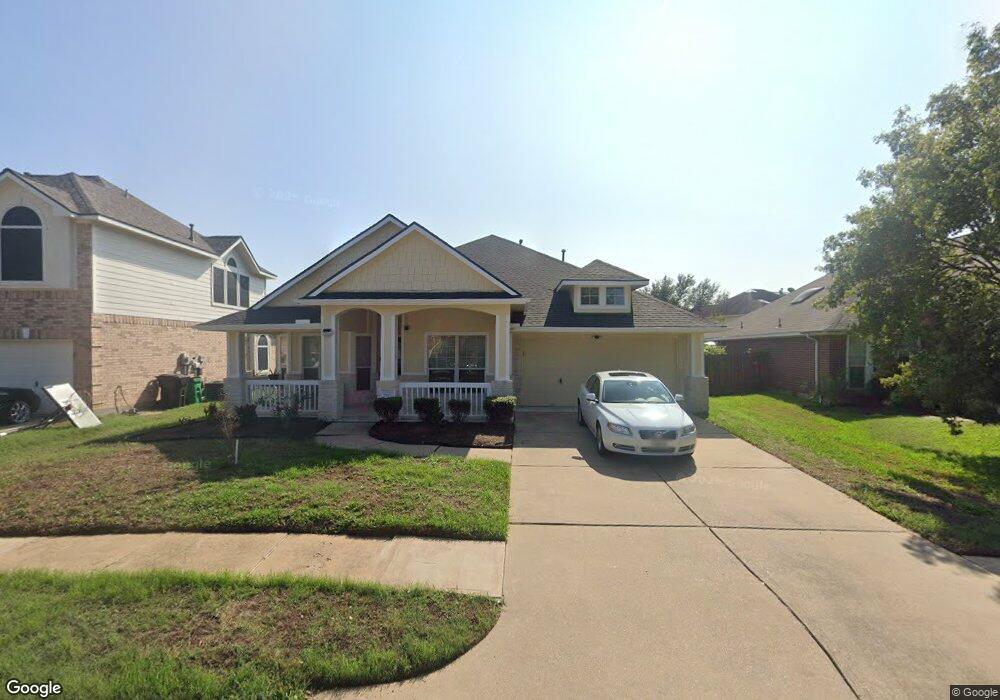
20619 Cypress Green Ln Cypress, TX 77433
Estimated Value: $279,000 - $318,000
3
Beds
2
Baths
2,559
Sq Ft
$115/Sq Ft
Est. Value
About This Home
This home is located at 20619 Cypress Green Ln, Cypress, TX 77433 and is currently estimated at $293,801, approximately $114 per square foot. 20619 Cypress Green Ln is a home located in Harris County with nearby schools including Duryea Elementary School, Hopper Middle School, and Cypress Springs High School.
Ownership History
Date
Name
Owned For
Owner Type
Purchase Details
Closed on
May 25, 2022
Sold by
Gordon Bruce R
Bought by
Gordon Bruce R
Current Estimated Value
Home Financials for this Owner
Home Financials are based on the most recent Mortgage that was taken out on this home.
Original Mortgage
$210,000
Outstanding Balance
$199,495
Interest Rate
5.25%
Mortgage Type
Credit Line Revolving
Estimated Equity
$94,306
Purchase Details
Closed on
Nov 29, 2004
Sold by
Hallmark Design Homes Lp
Bought by
Gordon Bruce R
Home Financials for this Owner
Home Financials are based on the most recent Mortgage that was taken out on this home.
Original Mortgage
$160,821
Interest Rate
5.68%
Mortgage Type
VA
Purchase Details
Closed on
May 26, 2004
Sold by
Cw Lt Ii Development Lp
Bought by
Hallmark Design Homes Llc
Create a Home Valuation Report for This Property
The Home Valuation Report is an in-depth analysis detailing your home's value as well as a comparison with similar homes in the area
Home Values in the Area
Average Home Value in this Area
Purchase History
| Date | Buyer | Sale Price | Title Company |
|---|---|---|---|
| Gordon Bruce R | -- | Vantage Point Title Inc | |
| Gordon Bruce R | -- | Stewart Title Houston Div | |
| Hallmark Design Homes Llc | -- | Stewart Title Houston |
Source: Public Records
Mortgage History
| Date | Status | Borrower | Loan Amount |
|---|---|---|---|
| Open | Gordon Bruce R | $210,000 | |
| Previous Owner | Gordon Bruce R | $160,821 | |
| Closed | Hallmark Design Homes Llc | $0 |
Source: Public Records
Tax History Compared to Growth
Tax History
| Year | Tax Paid | Tax Assessment Tax Assessment Total Assessment is a certain percentage of the fair market value that is determined by local assessors to be the total taxable value of land and additions on the property. | Land | Improvement |
|---|---|---|---|---|
| 2025 | -- | $307,706 | $51,052 | $256,654 |
| 2024 | -- | $309,006 | $51,052 | $257,954 |
| 2023 | $6,373 | $336,854 | $67,354 | $269,500 |
| 2022 | $6,472 | $303,018 | $44,902 | $258,116 |
| 2021 | $6,139 | $229,883 | $44,902 | $184,981 |
| 2020 | $5,797 | $207,460 | $38,646 | $168,814 |
| 2019 | $5,849 | $203,054 | $30,549 | $172,505 |
| 2018 | $0 | $187,326 | $30,549 | $156,777 |
| 2017 | $16,534 | $187,326 | $30,549 | $156,777 |
| 2016 | $5,010 | $187,326 | $30,549 | $156,777 |
| 2015 | -- | $168,327 | $25,764 | $142,563 |
| 2014 | -- | $149,432 | $25,764 | $123,668 |
Source: Public Records
Map
Nearby Homes
- 20702 Desert Shadows Ln
- 7615 Hillsdale Park Ct
- 20518 Pinos Verde Dr
- 21019 Seneca Bluff Ln
- 21039 Salt Rock Dr
- 21047 Salt Rock Dr
- 21054 Salt Rock Dr
- 21050 Salt Rock Dr
- 21043 Salt Rock Dr
- 21051 Salt Rock Dr
- 21046 Salt Rock Dr
- 7115 Crim Lilly Ct
- 20754 Cypress Crescent Ln
- 11114 Hindwing Trail
- 21311 Calico Aster Ct
- 7810 Starfish Arbor Dr
- 7555 Coral Lake Dr
- 7818 Starfish Arbor Dr
- 7730 Sagemark Ridge Dr
- 20703 Blanton Brook Dr
- 20623 Cypress Green Ln
- 20615 Cypress Green Ln
- 20626 Double Meadows Dr
- 20622 Double Meadows Dr
- 20627 Cypress Green Ln
- 20611 Cypress Green Ln
- 20618 Double Meadows Dr
- 20630 Double Meadows Dr
- 20618 Cypress Green Ln
- 20622 Cypress Green Ln
- 20614 Double Meadows Dr
- 20610 Cypress Green Ln
- 20606 Cypress Green Ln
- 20607 Cypress Green Ln
- 20626 Cypress Green Ln
- 20610 Double Meadows Dr
- 20602 Cypress Green Ln
- 7443 Cypress Bluff Dr
- 20623 Double Meadows Dr
- 7511 Cypress Bluff Dr