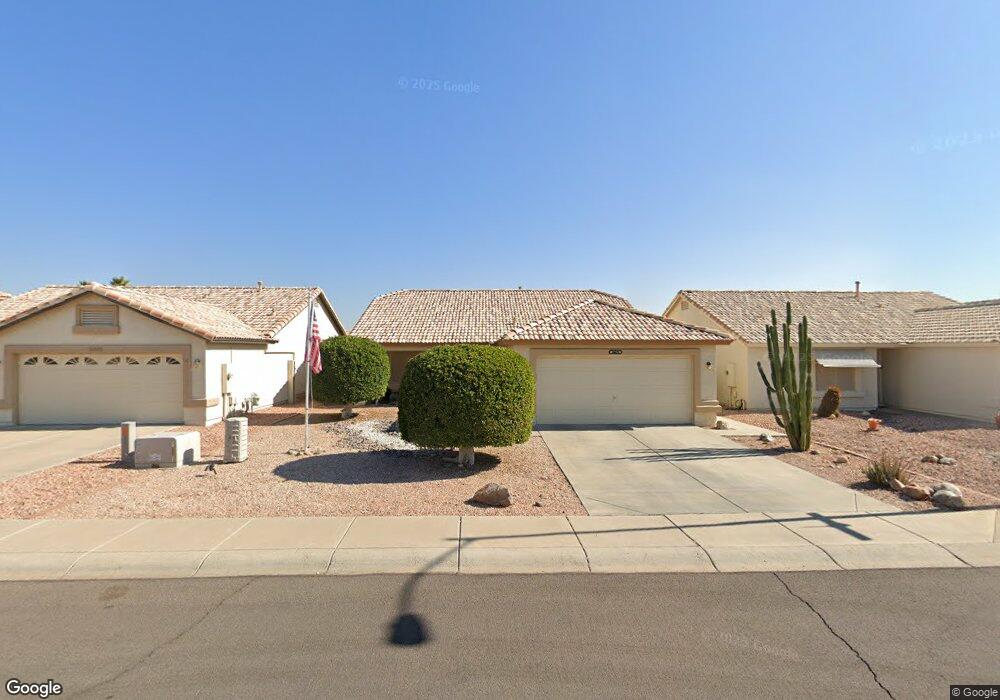
20625 N 103rd Dr Peoria, AZ 85382
Estimated Value: $351,000 - $370,000
3
Beds
2
Baths
1,456
Sq Ft
$247/Sq Ft
Est. Value
About This Home
This home is located at 20625 N 103rd Dr, Peoria, AZ 85382 and is currently estimated at $359,009, approximately $246 per square foot. 20625 N 103rd Dr is a home located in Maricopa County with nearby schools including Parkridge Elementary School, Sunrise Mountain High School, and Candeo Peoria.
Ownership History
Date
Name
Owned For
Owner Type
Purchase Details
Closed on
Sep 22, 2020
Sold by
Keddy David L and Keddy Danny D
Bought by
J & T Capital Llc
Current Estimated Value
Purchase Details
Closed on
Jul 28, 2020
Sold by
Perez Shwana D and Keddy David L
Bought by
Perez Shawna D and Keddy David L
Purchase Details
Closed on
Aug 14, 2008
Sold by
Livin Keddy Melvin G and Livin Melvin G Keddy Revocable
Bought by
Keedy Melvin G and Essig Joan
Purchase Details
Closed on
Jan 11, 2006
Sold by
Keddy Melvin G
Bought by
Keddy Melvin G
Purchase Details
Closed on
Apr 22, 1998
Sold by
Lennar Homes Of Arizona Inc
Bought by
Keddy Melvin G and Keddy Suanne
Home Financials for this Owner
Home Financials are based on the most recent Mortgage that was taken out on this home.
Original Mortgage
$55,000
Interest Rate
7.06%
Mortgage Type
New Conventional
Create a Home Valuation Report for This Property
The Home Valuation Report is an in-depth analysis detailing your home's value as well as a comparison with similar homes in the area
Home Values in the Area
Average Home Value in this Area
Purchase History
| Date | Buyer | Sale Price | Title Company |
|---|---|---|---|
| J & T Capital Llc | $240,000 | Lawyers Title Of Arizona Inc | |
| Perez Shawna D | -- | None Available | |
| Keedy Melvin G | -- | None Available | |
| Keddy Melvin G | -- | None Available | |
| Keddy Melvin G | $109,478 | North American Title Agency |
Source: Public Records
Mortgage History
| Date | Status | Borrower | Loan Amount |
|---|---|---|---|
| Previous Owner | Keddy Melvin G | $55,000 |
Source: Public Records
Tax History Compared to Growth
Tax History
| Year | Tax Paid | Tax Assessment Tax Assessment Total Assessment is a certain percentage of the fair market value that is determined by local assessors to be the total taxable value of land and additions on the property. | Land | Improvement |
|---|---|---|---|---|
| 2025 | $1,556 | $17,651 | -- | -- |
| 2024 | $1,660 | $16,810 | -- | -- |
| 2023 | $1,660 | $26,210 | $5,240 | $20,970 |
| 2022 | $1,627 | $20,580 | $4,110 | $16,470 |
| 2021 | $1,697 | $19,570 | $3,910 | $15,660 |
| 2020 | $1,460 | $17,360 | $3,470 | $13,890 |
| 2019 | $1,405 | $16,380 | $3,270 | $13,110 |
| 2018 | $1,351 | $15,520 | $3,100 | $12,420 |
| 2017 | $1,353 | $13,530 | $2,700 | $10,830 |
| 2016 | $1,338 | $13,350 | $2,670 | $10,680 |
| 2015 | $1,249 | $12,650 | $2,530 | $10,120 |
Source: Public Records
Map
Nearby Homes
- 10344 W Burnett Rd
- 10347 W Mohawk Ln
- 10379 W Tonopah Dr
- 10368 W Ross Ave
- 10169 W Potter Dr
- 20615 N 105th Ave
- 20274 N 104th Ave
- 10528 W Potter Dr
- 20670 N 105th Dr
- 10630 W Mohawk Ln
- 20017 N 101st Ave
- 20640 N 100th Ln
- 10134 W Pine Springs Dr
- 20046 N Welk Dr
- 20769 N 106th Ln
- 20037 N Welk Dr
- 10129 W Pine Springs Dr
- 20018 N Lakeforest Dr
- 20360 N 106th Ln
- 10672 W Ross Ave
- 20625 N 103rd Ave
- 20621 N 103rd Ave
- 20629 N 103rd Ave
- 20617 N 103rd Ave
- 20633 N 103rd Ave
- 20626 N 102nd Ln
- 20622 N 102nd Ln
- 20630 N 102nd Ln
- 20613 N 103rd Ave
- 20618 N 102nd Ln
- 20634 N 102nd Ln
- 20637 N 103rd Ave
- 20628 N 103rd Dr
- 20620 N 103rd Ave
- 20614 N 102nd Ln
- 20638 N 102nd Ln
- 20616 N 103rd Ave
- 20609 N 103rd Ave
- 20636 N 103rd Ave
- 20610 N 102nd Ln