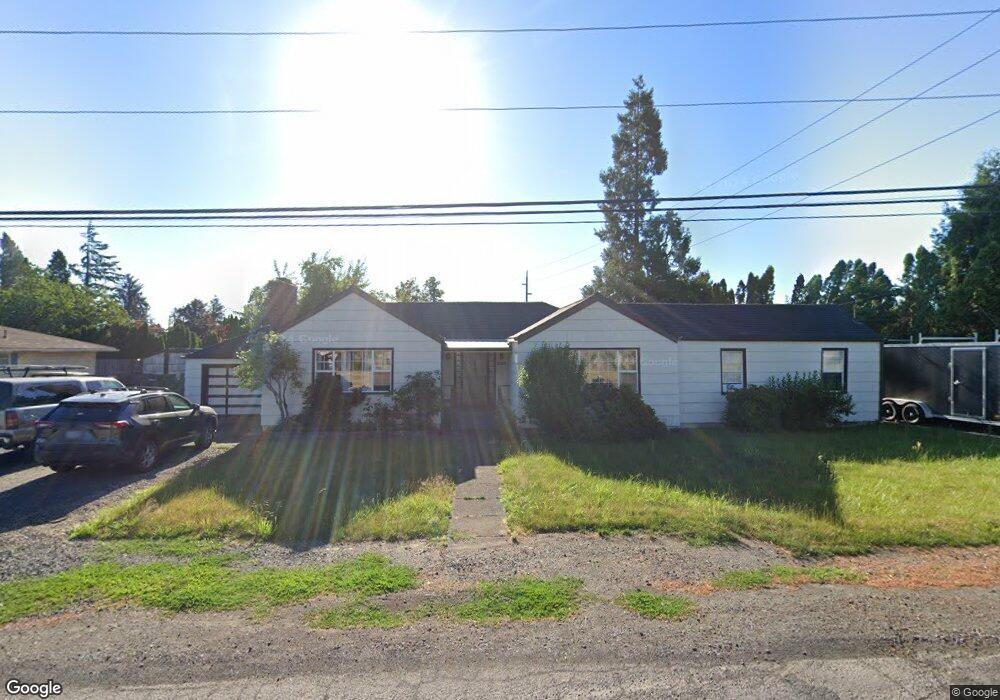
2063 N 2nd St Springfield, OR 97477
North Springfield NeighborhoodEstimated Value: $366,000 - $445,000
3
Beds
2
Baths
1,428
Sq Ft
$285/Sq Ft
Est. Value
About This Home
This home is located at 2063 N 2nd St, Springfield, OR 97477 and is currently estimated at $406,392, approximately $284 per square foot. 2063 N 2nd St is a home located in Lane County with nearby schools including Elizabeth Page Elementary School, Hamlin Middle School, and Springfield High School.
Ownership History
Date
Name
Owned For
Owner Type
Purchase Details
Closed on
Jan 3, 2019
Sold by
Mendoza Douglas and Underhill Phyl Mendoza
Bought by
Visser Karen E
Current Estimated Value
Purchase Details
Closed on
Jun 17, 2009
Sold by
Underhill Christopher L
Bought by
Underhill Phyl M
Purchase Details
Closed on
Apr 20, 2001
Sold by
Johnson Janel and Johnson Michael
Bought by
Underhill Christopher Lee and Underhill Phyl Mendoza
Home Financials for this Owner
Home Financials are based on the most recent Mortgage that was taken out on this home.
Original Mortgage
$124,500
Interest Rate
6.98%
Mortgage Type
VA
Create a Home Valuation Report for This Property
The Home Valuation Report is an in-depth analysis detailing your home's value as well as a comparison with similar homes in the area
Home Values in the Area
Average Home Value in this Area
Purchase History
| Date | Buyer | Sale Price | Title Company |
|---|---|---|---|
| Visser Karen E | $162,000 | Fidelity National Title | |
| Underhill Phyl M | -- | None Available | |
| Underhill Christopher Lee | $124,500 | Western Title & Escrow Compa |
Source: Public Records
Mortgage History
| Date | Status | Borrower | Loan Amount |
|---|---|---|---|
| Previous Owner | Underhill Christopher Lee | $124,500 |
Source: Public Records
Tax History
| Year | Tax Paid | Tax Assessment Tax Assessment Total Assessment is a certain percentage of the fair market value that is determined by local assessors to be the total taxable value of land and additions on the property. | Land | Improvement |
|---|---|---|---|---|
| 2025 | $3,410 | $185,934 | -- | -- |
| 2024 | $3,354 | $180,519 | -- | -- |
| 2023 | $3,354 | $175,262 | $0 | $0 |
| 2022 | $3,107 | $170,158 | $0 | $0 |
| 2021 | $3,051 | $165,202 | $0 | $0 |
| 2020 | $2,962 | $160,391 | $0 | $0 |
| 2019 | $2,873 | $155,720 | $0 | $0 |
| 2018 | $2,708 | $146,782 | $0 | $0 |
| 2017 | $2,604 | $146,782 | $0 | $0 |
| 2016 | $2,549 | $142,507 | $0 | $0 |
| 2015 | $2,477 | $138,356 | $0 | $0 |
| 2014 | $2,439 | $134,326 | $0 | $0 |
Source: Public Records
Map
Nearby Homes
- 77 Shady Loop
- 421 Woodlane Dr
- 126 Woodlane Dr
- 2136 8th St
- 212 Hayden Bridge Way
- 780 Q St
- 364 Scotts Glen Dr
- 2268 9th St
- 2150 Laura St Unit 119
- 2150 Laura St Unit 111
- 2150 Laura St Unit 39
- 2150 Laura St Unit 57
- 2150 Laura St Unit 83
- 2150 Laura St Unit 44
- 2150 Laura (#57) St Unit 57
- 40 Allen Ave
- 937 S St
- 970 T St
- 451 Lochaven Ave
- 817 River Knoll Way
Your Personal Tour Guide
Ask me questions while you tour the home.