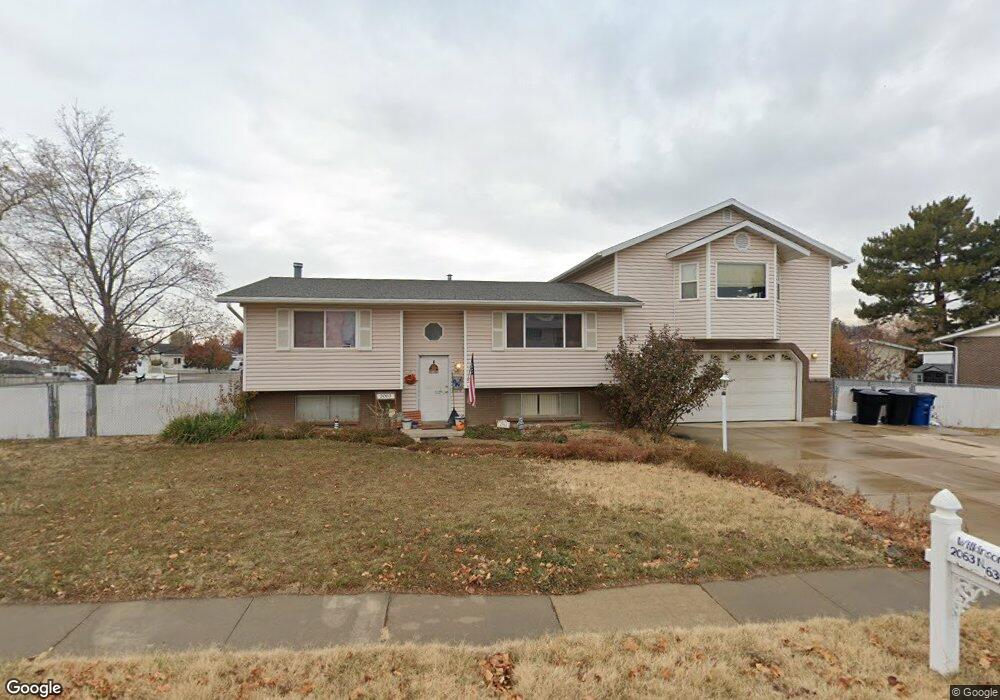
2063 N 630 W Clearfield, UT 84015
Estimated Value: $470,000 - $492,000
4
Beds
2
Baths
2,350
Sq Ft
$205/Sq Ft
Est. Value
About This Home
This home is located at 2063 N 630 W, Clearfield, UT 84015 and is currently estimated at $481,590, approximately $204 per square foot. 2063 N 630 W is a home located in Davis County with nearby schools including Fremont School, Sunset Junior High School, and Northridge High School.
Ownership History
Date
Name
Owned For
Owner Type
Purchase Details
Closed on
Jun 11, 2010
Sold by
Wilkinson Brent
Bought by
Wilkinson Brent and Wilkinson Melissa J
Current Estimated Value
Home Financials for this Owner
Home Financials are based on the most recent Mortgage that was taken out on this home.
Original Mortgage
$177,213
Outstanding Balance
$119,936
Interest Rate
5.25%
Mortgage Type
FHA
Estimated Equity
$361,654
Purchase Details
Closed on
Jun 7, 2010
Sold by
Checketts Robert Sheldon and Checketts Pamela Mary Lynn
Bought by
Wilkinson Brent
Home Financials for this Owner
Home Financials are based on the most recent Mortgage that was taken out on this home.
Original Mortgage
$177,213
Outstanding Balance
$119,936
Interest Rate
5.25%
Mortgage Type
FHA
Estimated Equity
$361,654
Purchase Details
Closed on
Jun 26, 2007
Sold by
Checketts Robert S and Checketts Pamela M L
Bought by
Checketts Robert Sheldon and Checketts Pamela Mary Lynn
Create a Home Valuation Report for This Property
The Home Valuation Report is an in-depth analysis detailing your home's value as well as a comparison with similar homes in the area
Home Values in the Area
Average Home Value in this Area
Purchase History
| Date | Buyer | Sale Price | Title Company |
|---|---|---|---|
| Wilkinson Brent | -- | None Available | |
| Wilkinson Brent | -- | Inwest Title Services Inc | |
| Checketts Robert Sheldon | -- | None Available |
Source: Public Records
Mortgage History
| Date | Status | Borrower | Loan Amount |
|---|---|---|---|
| Open | Wilkinson Brent | $177,213 |
Source: Public Records
Tax History Compared to Growth
Tax History
| Year | Tax Paid | Tax Assessment Tax Assessment Total Assessment is a certain percentage of the fair market value that is determined by local assessors to be the total taxable value of land and additions on the property. | Land | Improvement |
|---|---|---|---|---|
| 2025 | $2,648 | $254,650 | $85,976 | $168,674 |
| 2024 | $2,583 | $249,700 | $94,491 | $155,209 |
| 2023 | $2,354 | $421,000 | $107,532 | $313,468 |
| 2022 | $2,502 | $247,500 | $65,749 | $181,751 |
| 2021 | $2,269 | $333,000 | $82,358 | $250,642 |
| 2020 | $1,962 | $285,000 | $70,005 | $214,995 |
| 2019 | $1,910 | $271,000 | $81,761 | $189,239 |
| 2018 | $1,671 | $233,000 | $69,052 | $163,948 |
| 2016 | $1,467 | $105,600 | $26,894 | $78,706 |
| 2015 | $1,406 | $96,250 | $26,894 | $69,356 |
| 2014 | $1,405 | $97,681 | $26,894 | $70,787 |
| 2013 | -- | $88,361 | $25,230 | $63,131 |
Source: Public Records
Map
Nearby Homes
- 648 W 2200 N
- 2177 N 450 W
- 1746 N 475 W
- 1721 N 400 W
- 1696 N 475 W
- 2382 N 770 W
- 1874 N 200 W
- 2486 N 690 W
- 1974 N 75 W
- 2085 N Main St Unit 409
- 2085 N Main St Unit 108
- 2085 N Main St Unit 401
- 2085 N Main St Unit 308
- 2085 N Main St Unit 116
- 2085 N Main St Unit 201
- 2085 N Main St Unit 402
- 2085 N Main St Unit 202
- 2085 N Main St Unit 301
- 2085 N Main St Unit 302
- 2085 N Main St Unit 115