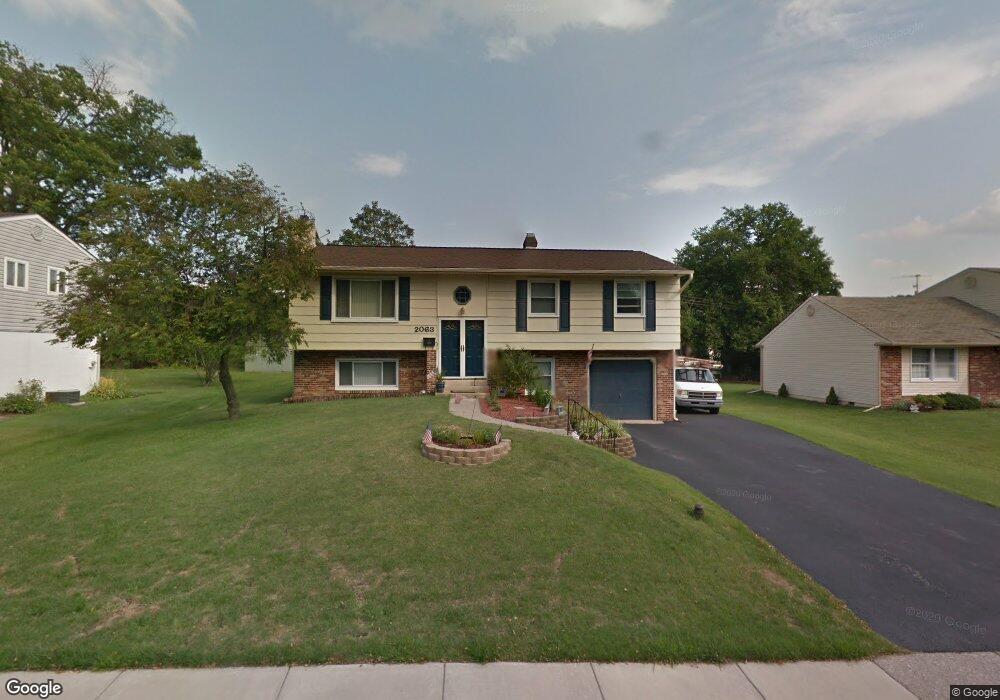
2063 Sierra Rd Plymouth Meeting, PA 19462
Estimated Value: $563,896 - $608,000
4
Beds
3
Baths
1,824
Sq Ft
$321/Sq Ft
Est. Value
About This Home
This home is located at 2063 Sierra Rd, Plymouth Meeting, PA 19462 and is currently estimated at $585,224, approximately $320 per square foot. 2063 Sierra Rd is a home located in Montgomery County with nearby schools including Ridge Park Elementary School, Colonial Elementary School, and Colonial Middle School.
Ownership History
Date
Name
Owned For
Owner Type
Purchase Details
Closed on
Feb 10, 2025
Sold by
Gunn Lora Lee
Bought by
Lora L Gunn Family Trust and Gunn
Current Estimated Value
Purchase Details
Closed on
Jun 8, 2015
Sold by
Terraces Lora Gunn and Gunn Lora Lee
Bought by
Gunn Lora Lee
Home Financials for this Owner
Home Financials are based on the most recent Mortgage that was taken out on this home.
Original Mortgage
$256,410
Interest Rate
4.5%
Mortgage Type
FHA
Purchase Details
Closed on
Oct 29, 2004
Sold by
Not Provided
Bought by
Gunn Terrraces Lora
Purchase Details
Closed on
Jan 26, 1996
Sold by
Murch Franklin B and Murch Nanae K
Bought by
Terraces James R and Gunn Terraces Lora
Create a Home Valuation Report for This Property
The Home Valuation Report is an in-depth analysis detailing your home's value as well as a comparison with similar homes in the area
Home Values in the Area
Average Home Value in this Area
Purchase History
| Date | Buyer | Sale Price | Title Company |
|---|---|---|---|
| Lora L Gunn Family Trust | -- | Accommodation/Courtesy Recordi | |
| Lora L Gunn Family Trust | -- | Accommodation/Courtesy Recordi | |
| Gunn Lora Lee | -- | Accommodation | |
| Gunn Terrraces Lora | -- | -- | |
| Terraces James R | $150,000 | -- |
Source: Public Records
Mortgage History
| Date | Status | Borrower | Loan Amount |
|---|---|---|---|
| Previous Owner | Gunn Lora Lee | $256,410 | |
| Closed | Gunn Terrraces Lora | $0 |
Source: Public Records
Tax History Compared to Growth
Tax History
| Year | Tax Paid | Tax Assessment Tax Assessment Total Assessment is a certain percentage of the fair market value that is determined by local assessors to be the total taxable value of land and additions on the property. | Land | Improvement |
|---|---|---|---|---|
| 2025 | $4,775 | $145,500 | $51,070 | $94,430 |
| 2024 | $4,775 | $145,500 | $51,070 | $94,430 |
| 2023 | $4,589 | $145,500 | $51,070 | $94,430 |
| 2022 | $4,485 | $145,500 | $51,070 | $94,430 |
| 2021 | $4,337 | $145,500 | $51,070 | $94,430 |
| 2020 | $4,188 | $145,500 | $51,070 | $94,430 |
| 2019 | $4,063 | $145,500 | $51,070 | $94,430 |
| 2018 | $866 | $145,500 | $51,070 | $94,430 |
| 2017 | $3,916 | $145,500 | $51,070 | $94,430 |
| 2016 | $3,859 | $145,500 | $51,070 | $94,430 |
| 2015 | $3,618 | $145,500 | $51,070 | $94,430 |
| 2014 | $3,618 | $145,500 | $51,070 | $94,430 |
Source: Public Records
Map
Nearby Homes
- 4 Cardinal Dr
- 25 E Germantown Pike
- 1975 West Ave
- 3 Taylor Rd
- 1705 Harmon Rd
- 4048 Friends Ln
- 239 Birch Dr
- 10 Maple Dr
- 117 Carriage Ct
- 2134 Birch Dr
- 210 Ella Ln
- 2150 Julia Dr
- 264 Roberts Ave Unit 10
- 1410 Butler Pike
- 4 Arthurs Ct
- 1408 Butler Pike
- 26 Cherry Ct
- 106 Barefield Ln
- 121 Scarlet Dr
- 1322 Midland Rd
- 2065 Sierra Rd
- 2061 Sierra Rd
- 2059 Sierra Rd
- 2067 Sierra Rd
- 2064 Sierra Rd
- 100 Boulder Rd
- 2070 Butler Pike
- 102 Boulder Rd
- 101 Black Hill Rd
- 2069 Sierra Rd
- 2057 Sierra Rd
- 2060 Sierra Rd
- 3068 Butler Pike
- 104 Boulder Rd
- 103 Black Hill Rd
- 2071 Sierra Rd
- 102 Black Hill Rd
- 103 Boulder Rd
- 106 Boulder Rd
- 100 Shasta Rd