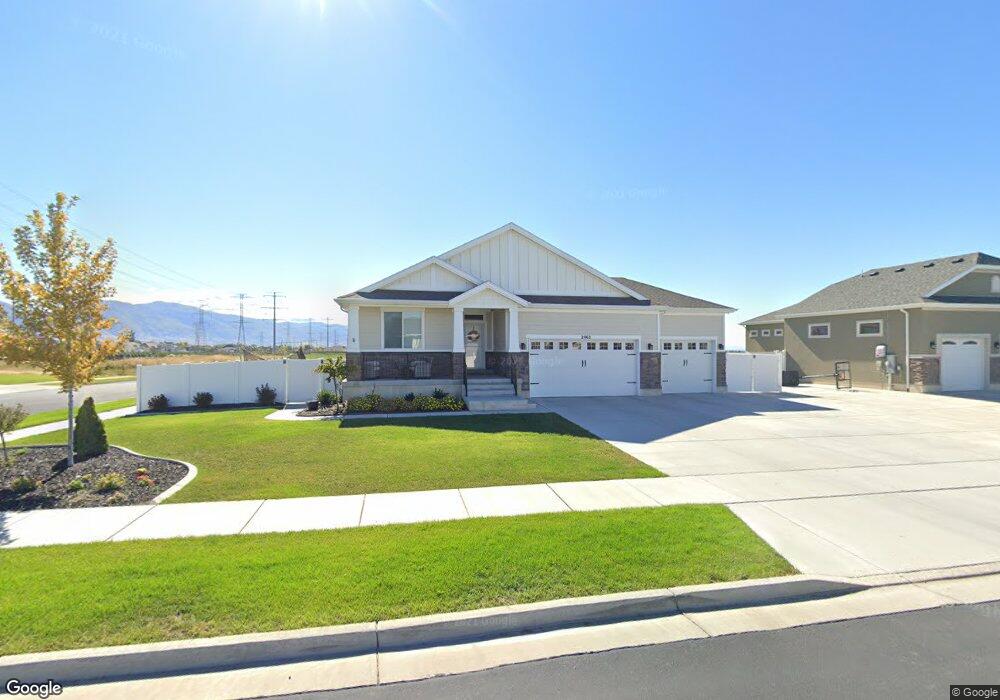
2063 W Fox Tail Dr Layton, UT 84041
Estimated Value: $657,000 - $702,038
6
Beds
3
Baths
3,283
Sq Ft
$209/Sq Ft
Est. Value
About This Home
This home is located at 2063 W Fox Tail Dr, Layton, UT 84041 and is currently estimated at $685,760, approximately $208 per square foot. 2063 W Fox Tail Dr is a home located in Davis County with nearby schools including Shoreline Junior High School, Layton High School, and North Davis Preparatory Academy.
Ownership History
Date
Name
Owned For
Owner Type
Purchase Details
Closed on
Apr 16, 2025
Sold by
Metcalf Taylor and Metcalf Elizabeth
Bought by
Danielson Broderick and Danielson Alexis
Current Estimated Value
Purchase Details
Closed on
May 29, 2018
Sold by
Lewin Robert and Lewin Sheri
Bought by
Metcalf Taylor and Metcalf Elizabeth
Home Financials for this Owner
Home Financials are based on the most recent Mortgage that was taken out on this home.
Original Mortgage
$166,056
Interest Rate
4.4%
Mortgage Type
FHA
Purchase Details
Closed on
May 18, 2017
Sold by
Norton Charolee
Bought by
Lewin Robert and Lewin Sheri
Home Financials for this Owner
Home Financials are based on the most recent Mortgage that was taken out on this home.
Original Mortgage
$147,621
Interest Rate
4.1%
Mortgage Type
FHA
Purchase Details
Closed on
Jan 27, 2016
Sold by
Norton Gabriel M
Bought by
Norton Charolee
Create a Home Valuation Report for This Property
The Home Valuation Report is an in-depth analysis detailing your home's value as well as a comparison with similar homes in the area
Home Values in the Area
Average Home Value in this Area
Purchase History
| Date | Buyer | Sale Price | Title Company |
|---|---|---|---|
| Danielson Broderick | -- | Steed Title | |
| Metcalf Taylor | -- | None Available | |
| Lewin Robert | -- | Backman Title | |
| Norton Charolee | -- | -- |
Source: Public Records
Mortgage History
| Date | Status | Borrower | Loan Amount |
|---|---|---|---|
| Previous Owner | Metcalf Taylor | $166,056 | |
| Previous Owner | Lewin Robert | $147,621 | |
| Previous Owner | Lewin Robert | $393,900 |
Source: Public Records
Tax History Compared to Growth
Tax History
| Year | Tax Paid | Tax Assessment Tax Assessment Total Assessment is a certain percentage of the fair market value that is determined by local assessors to be the total taxable value of land and additions on the property. | Land | Improvement |
|---|---|---|---|---|
| 2025 | $3,217 | $337,700 | $117,707 | $219,993 |
| 2024 | $3,157 | $333,850 | $127,527 | $206,323 |
| 2023 | $3,031 | $565,000 | $131,607 | $433,393 |
| 2022 | $3,331 | $337,151 | $78,656 | $258,495 |
| 2021 | $3,200 | $483,000 | $117,982 | $365,018 |
| 2020 | $2,893 | $419,000 | $100,222 | $318,778 |
| 2019 | $3,053 | $433,000 | $100,524 | $332,476 |
| 2018 | $1,767 | $398,000 | $88,421 | $309,579 |
| 2016 | $2,451 | $180,015 | $35,919 | $144,096 |
| 2015 | $650 | $45,358 | $35,919 | $9,439 |
Source: Public Records
Map
Nearby Homes
- 2182 W Evergreen Way Unit 143
- 583 S Alberta Spruce Dr
- 1919 W 850 S
- 920 S 1700 W Unit 1
- 306 S Sunburst Dr
- 796 S Rock Creek Corner
- 1124 S Neville St
- 2184 W Gentile St
- 37 N Swift Creek Dr
- 1234 S Grace Way
- 1278 S Grace Way
- 163 Cold Creek Way
- 2875 N Hill Rd Unit 199
- 2875 N Hill Rd Unit 27
- 557 S Angel St
- 1606 W 200 N
- 306 Swift Creek Dr
- 2794 W Gentile St
- Browning Plan at Amber Fields
- Rhapsody Plan at Amber Fields
- 2075 W Foxtail Dr
- 577 S White Pine Dr
- 583 S White Pine Dr Unit 121
- 544 S White Pine Dr
- 544 S White Pine Dr Unit 132
- 2089 W Foxtail Dr Unit 118
- 2089 W Foxtail Dr
- 551 S White Pine Dr
- 2090 W Foxtail Dr
- 2087 W White Pine Dr
- 2087 W White Pine Dr Unit 131
- 535 S White Pine Dr
- 535 S White Pine Dr Unit 124
- 2103 W Foxtail Dr Unit 117
- 2103 W Foxtail Dr
- 2112 W Foxtail Dr
- 2107 W White Pine Dr Unit 130
- 2074 W White Pine Dr Unit 125
- 2086 W White Pine Dr
- 621 S Sugar Pine Dr Unit 115