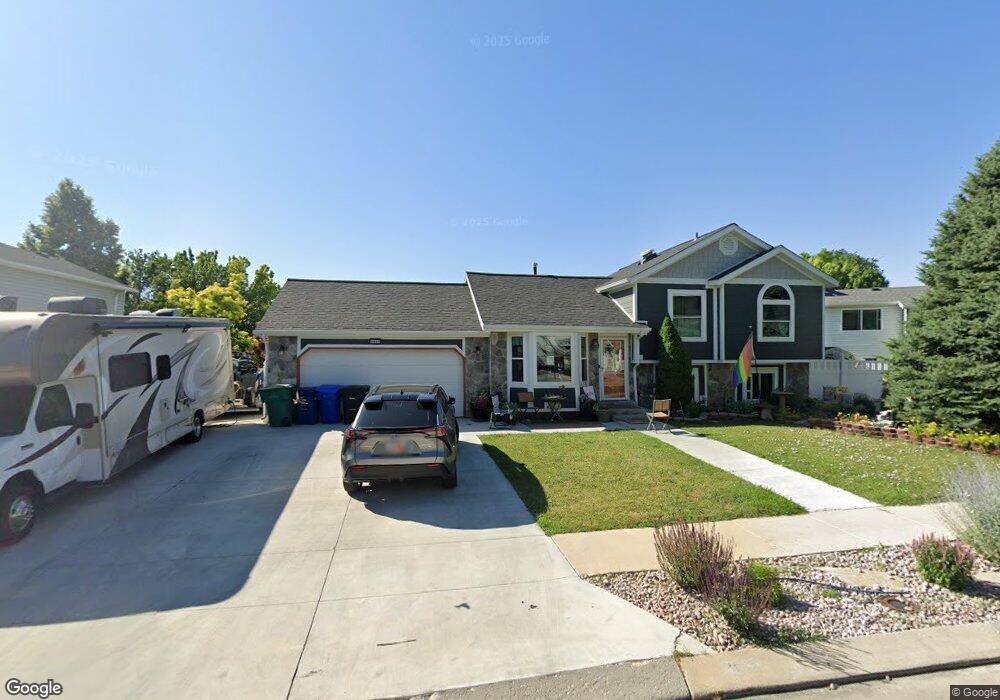
2063 Wasa St West Jordan, UT 84088
Estimated Value: $543,000 - $648,000
4
Beds
2
Baths
2,028
Sq Ft
$283/Sq Ft
Est. Value
About This Home
This home is located at 2063 Wasa St, West Jordan, UT 84088 and is currently estimated at $573,116, approximately $282 per square foot. 2063 Wasa St is a home located in Salt Lake County with nearby schools including Westvale Elementary School, West Jordan Middle School, and West Jordan High School.
Ownership History
Date
Name
Owned For
Owner Type
Purchase Details
Closed on
Mar 9, 2022
Sold by
Parkin Roger B and Parkin Tricia L
Bought by
Roger B And Tricia L Jones-Parkin Family
Current Estimated Value
Home Financials for this Owner
Home Financials are based on the most recent Mortgage that was taken out on this home.
Original Mortgage
$400,000
Outstanding Balance
$373,729
Interest Rate
3.92%
Mortgage Type
New Conventional
Estimated Equity
$199,387
Purchase Details
Closed on
Mar 4, 2022
Sold by
Parkin Roger B and Parkin Tricia L
Bought by
Roger B And Tricia L Jones-Parkin Family
Home Financials for this Owner
Home Financials are based on the most recent Mortgage that was taken out on this home.
Original Mortgage
$400,000
Outstanding Balance
$373,729
Interest Rate
3.92%
Mortgage Type
New Conventional
Estimated Equity
$199,387
Purchase Details
Closed on
Feb 5, 2021
Sold by
Parkin Roger B
Bought by
Parkin Roger B and Jones Parkin Tricia
Home Financials for this Owner
Home Financials are based on the most recent Mortgage that was taken out on this home.
Original Mortgage
$311,250
Interest Rate
2.6%
Mortgage Type
New Conventional
Purchase Details
Closed on
Oct 18, 2017
Sold by
Parkin Roger B and Jones Parkin Tricia L
Bought by
Parkin Roger B and Jones Parkin Tricia L
Home Financials for this Owner
Home Financials are based on the most recent Mortgage that was taken out on this home.
Original Mortgage
$246,489
Interest Rate
4.37%
Mortgage Type
FHA
Purchase Details
Closed on
Mar 12, 2008
Sold by
Parkin Roger B and Jones Parkin Tricia L
Bought by
Parkin Roger B and Jones Parkin Tricia L
Home Financials for this Owner
Home Financials are based on the most recent Mortgage that was taken out on this home.
Original Mortgage
$235,480
Interest Rate
5.72%
Mortgage Type
FHA
Purchase Details
Closed on
Mar 21, 2007
Sold by
Parkin Roger B
Bought by
Parkin Roger B and Jones Parkin Tricia L
Purchase Details
Closed on
Feb 7, 2006
Sold by
Young Brent R and Young Tiffany
Bought by
Parkin Roger B
Home Financials for this Owner
Home Financials are based on the most recent Mortgage that was taken out on this home.
Original Mortgage
$46,000
Interest Rate
6.04%
Mortgage Type
Stand Alone Second
Purchase Details
Closed on
May 24, 1999
Sold by
Peterson Jesse L and Peterson Tammy D
Bought by
Young Brent R and Young Tiffany
Home Financials for this Owner
Home Financials are based on the most recent Mortgage that was taken out on this home.
Original Mortgage
$149,850
Interest Rate
6.92%
Create a Home Valuation Report for This Property
The Home Valuation Report is an in-depth analysis detailing your home's value as well as a comparison with similar homes in the area
Home Values in the Area
Average Home Value in this Area
Purchase History
| Date | Buyer | Sale Price | Title Company |
|---|---|---|---|
| Roger B And Tricia L Jones-Parkin Family | -- | -- | |
| Parkin Roger B | -- | None Listed On Document | |
| Roger B And Tricia L Jones-Parkin Family | -- | -- | |
| Parkin Roger B | -- | None Listed On Document | |
| Parkin Roger B | -- | Meridian Title | |
| Parkin Roger B | -- | Meridian Title | |
| Parkin Roger B | -- | Meridian Title | |
| Parkin Roger B | -- | Meridian Title | |
| Parkin Roger B | -- | Title One | |
| Parkin Roger B | -- | Title One | |
| Parkin Roger B | -- | None Available | |
| Parkin Roger B | -- | Meridian Title | |
| Young Brent R | -- | First American Title Ins Co |
Source: Public Records
Mortgage History
| Date | Status | Borrower | Loan Amount |
|---|---|---|---|
| Open | Parkin Roger B | $400,000 | |
| Closed | Parkin Roger B | $400,000 | |
| Previous Owner | Parkin Roger B | $311,250 | |
| Previous Owner | Parkin Roger B | $246,489 | |
| Previous Owner | Parkin Roger B | $235,480 | |
| Previous Owner | Parkin Roger B | $46,000 | |
| Previous Owner | Parkin Roger B | $184,000 | |
| Previous Owner | Young Brent R | $149,850 |
Source: Public Records
Tax History Compared to Growth
Tax History
| Year | Tax Paid | Tax Assessment Tax Assessment Total Assessment is a certain percentage of the fair market value that is determined by local assessors to be the total taxable value of land and additions on the property. | Land | Improvement |
|---|---|---|---|---|
| 2025 | $2,428 | $506,900 | $174,300 | $332,600 |
| 2024 | $2,428 | $467,100 | $160,700 | $306,400 |
| 2023 | $2,454 | $445,000 | $151,600 | $293,400 |
| 2022 | $2,546 | $454,100 | $148,600 | $305,500 |
| 2021 | $2,140 | $347,500 | $119,900 | $227,600 |
| 2020 | $2,014 | $306,900 | $119,900 | $187,000 |
| 2019 | $2,041 | $305,000 | $119,900 | $185,100 |
| 2018 | $1,915 | $283,900 | $87,900 | $196,000 |
| 2017 | $1,800 | $265,700 | $87,900 | $177,800 |
| 2016 | $1,761 | $244,200 | $87,900 | $156,300 |
| 2015 | $1,779 | $240,500 | $92,100 | $148,400 |
| 2014 | $1,663 | $221,300 | $85,400 | $135,900 |
Source: Public Records
Map
Nearby Homes
- 8383 S 2200 W
- 14 San Miguel St
- 8140 S 2245 W
- 48 San Rafael Ct
- 77 Rio Bravo Place
- 1790 W Sugar Factory Rd
- 8461 S 2385 W
- 1689 W 8295 S Unit 2
- 8026 Laguna Cir
- 2497 Bueno Vista Dr
- 8510 S Redwood Rd
- 8518 S Redwood Rd
- 1636 Plum Creek Dr
- 8534 S Redwood Rd
- 8155 S Redwood Rd Unit 88
- 8155 S Redwood Rd Unit 142B
- 8155 S Redwood Rd Unit 95
- 8155 S Redwood Rd Unit 28
- 1773 W 8760 S
- 2041 W 8820 S