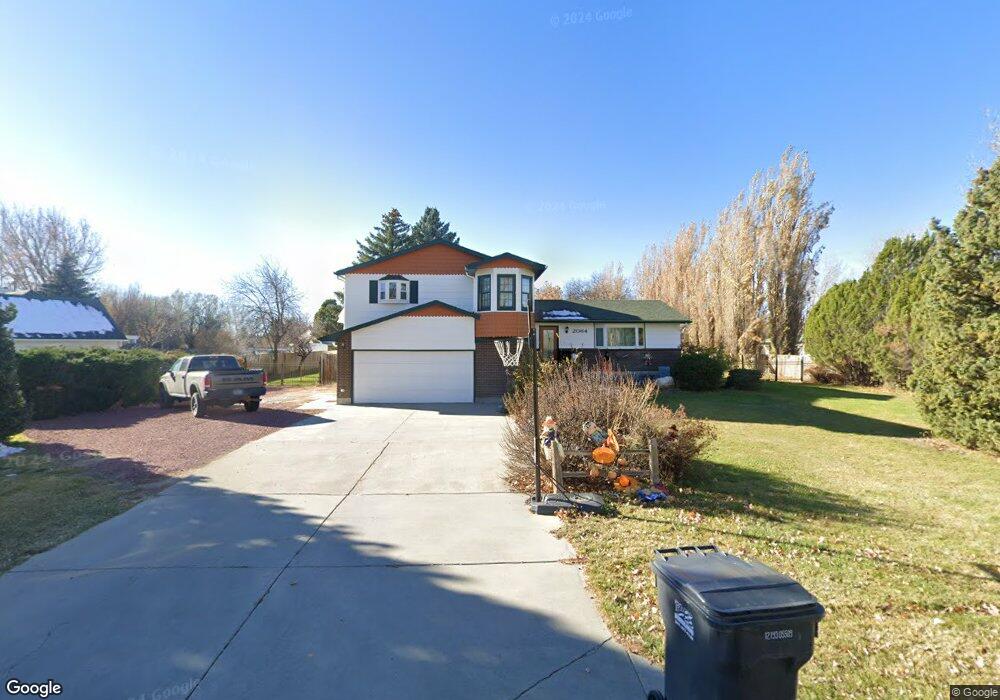
2064 Piney Creek Rd Casper, WY 82604
Estimated Value: $580,000 - $601,569
4
Beds
3
Baths
2,862
Sq Ft
$206/Sq Ft
Est. Value
About This Home
This home is located at 2064 Piney Creek Rd, Casper, WY 82604 and is currently estimated at $590,523, approximately $206 per square foot. 2064 Piney Creek Rd is a home located in Natrona County.
Ownership History
Date
Name
Owned For
Owner Type
Purchase Details
Closed on
Feb 18, 2020
Sold by
Etchegaray Cherie L and Etchegaray Raymond D
Bought by
Groce Mark R and Groce Nohora C
Current Estimated Value
Home Financials for this Owner
Home Financials are based on the most recent Mortgage that was taken out on this home.
Original Mortgage
$293,250
Outstanding Balance
$259,155
Interest Rate
3.5%
Mortgage Type
New Conventional
Estimated Equity
$331,368
Purchase Details
Closed on
Jan 10, 2018
Sold by
Hoyer Roy
Bought by
Etchegaray Cherie and Etchegaray Raymond D
Purchase Details
Closed on
Aug 4, 2017
Sold by
Hoyer Roy G
Bought by
Hoyer Roy
Purchase Details
Closed on
Oct 5, 2012
Sold by
Snyder Troy R
Bought by
Hoyer Roy and Hoyer Brenda C
Purchase Details
Closed on
Sep 30, 2011
Sold by
Peterson Brion J and Peterson Teresa Deanne
Bought by
Snyder Tory R and Snyder Rikki Lynn
Create a Home Valuation Report for This Property
The Home Valuation Report is an in-depth analysis detailing your home's value as well as a comparison with similar homes in the area
Home Values in the Area
Average Home Value in this Area
Purchase History
| Date | Buyer | Sale Price | Title Company |
|---|---|---|---|
| Groce Mark R | -- | Rocky Mountain Title | |
| Etchegaray Cherie | -- | American Title Agency | |
| Hoyer Roy | -- | None Available | |
| Hoyer Roy | -- | -- | |
| Snyder Tory R | -- | -- |
Source: Public Records
Mortgage History
| Date | Status | Borrower | Loan Amount |
|---|---|---|---|
| Open | Groce Mark R | $293,250 |
Source: Public Records
Tax History Compared to Growth
Tax History
| Year | Tax Paid | Tax Assessment Tax Assessment Total Assessment is a certain percentage of the fair market value that is determined by local assessors to be the total taxable value of land and additions on the property. | Land | Improvement |
|---|---|---|---|---|
| 2025 | $2,270 | $33,975 | $5,205 | $28,770 |
| 2024 | $2,860 | $42,735 | $6,673 | $36,062 |
| 2023 | $3,116 | $45,825 | $6,781 | $39,044 |
| 2022 | $3,209 | $47,191 | $3,670 | $43,521 |
| 2021 | $2,615 | $38,449 | $9,535 | $28,914 |
| 2020 | $2,531 | $37,206 | $6,475 | $30,731 |
| 2019 | $3,194 | $46,966 | $3,990 | $42,976 |
| 2018 | $2,954 | $37,600 | $5,786 | $31,814 |
| 2017 | $3,641 | $39,177 | $5,786 | $33,391 |
| 2015 | $3,496 | $37,045 | $5,786 | $31,259 |
| 2014 | $2,952 | $29,032 | $5,786 | $23,246 |
Source: Public Records
Map
Nearby Homes
- 2019 N Yellow Creek Rd
- 7824 Zero Rd
- 7825 W Zero Rd
- 6874 W Yellowstone
- Lot 4 Elton Ct
- 0 Commerce Dr
- 598 N Robertson Rd
- 5675 Chapman Place
- 6580 Meadow Wind Way
- 6570 Meadow Wind Way
- 6374 Meadow Wind Way
- 5451 W Yellowstone Hwy
- 0 Robertson Rd
- 6130 Stillwater Way
- 1243 River Heights Dr
- 84 S 4th Ave
- 243 S 4th Ave
- 323 S 4th Ave
- 6060 Rivers Gate
- 813 S 6th Ave
- 2064 Piney Creek Rd Unit 6wn
- 2064 Piney Creek Rd Unit 6 mile Rd.
- 2088 Piney Creek Rd
- 2038 Piney Creek Rd
- 2061 Piney Creek Rd
- 2087 Piney Creek Rd
- 2126 Piney Creek Rd
- 2018 Piney Creek Rd
- 2109 Piney Creek Rd
- 2109 Piney Creek Rd Unit 6 WN Road
- 2109 Piney Creek Rd Unit 6WN
- 1994 Piney Creek Rd
- 2131 Piney Creek Rd
- 2131 N Piney Creek Rd
- 2019 Piney Creek Rd
- 7929 W Sims Creek Rd
- 7929 W Sims Creek Rd Unit Piney Creek
- 2065 N Yellow Creek Rd
- 2039 N Yellow Creek Rd
- 7945 W Sims Creek Rd