Estimated Value: $375,000 - $427,000
5
Beds
2
Baths
2,202
Sq Ft
$181/Sq Ft
Est. Value
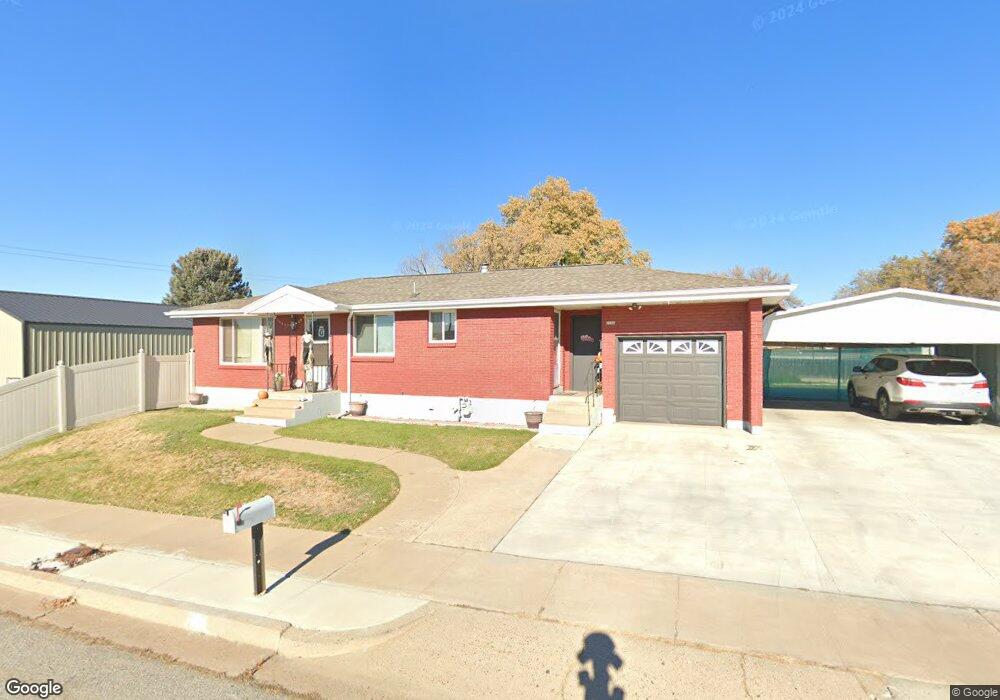
About This Home
This home is located at 2064 W 6075 S, Roy, UT 84067 and is currently estimated at $397,987, approximately $180 per square foot. 2064 W 6075 S is a home located in Weber County with nearby schools including Municipal School, Roy Junior High School, and Roy High School.
Ownership History
Date
Name
Owned For
Owner Type
Purchase Details
Closed on
Nov 6, 2017
Sold by
Gomez Danie
Bought by
Gomez Daniel and Gomez Veronica
Current Estimated Value
Purchase Details
Closed on
Jul 19, 2004
Sold by
Sawyer Neal L and Sawyer Patti A
Bought by
Gomez Daniel
Home Financials for this Owner
Home Financials are based on the most recent Mortgage that was taken out on this home.
Original Mortgage
$106,312
Outstanding Balance
$53,285
Interest Rate
6.27%
Mortgage Type
Purchase Money Mortgage
Estimated Equity
$344,702
Create a Home Valuation Report for This Property
The Home Valuation Report is an in-depth analysis detailing your home's value as well as a comparison with similar homes in the area
Home Values in the Area
Average Home Value in this Area
Purchase History
| Date | Buyer | Sale Price | Title Company |
|---|---|---|---|
| Gomez Daniel | -- | None Available | |
| Gomez Daniel | -- | Mountain View Title Ogden |
Source: Public Records
Mortgage History
| Date | Status | Borrower | Loan Amount |
|---|---|---|---|
| Open | Gomez Daniel | $106,312 |
Source: Public Records
Tax History Compared to Growth
Tax History
| Year | Tax Paid | Tax Assessment Tax Assessment Total Assessment is a certain percentage of the fair market value that is determined by local assessors to be the total taxable value of land and additions on the property. | Land | Improvement |
|---|---|---|---|---|
| 2025 | $2,504 | $393,755 | $130,287 | $263,468 |
| 2024 | $2,460 | $214,498 | $71,666 | $142,832 |
| 2023 | $2,268 | $196,900 | $65,252 | $131,648 |
| 2022 | $2,536 | $229,350 | $56,405 | $172,945 |
| 2021 | $1,841 | $269,000 | $72,234 | $196,766 |
| 2020 | $1,729 | $232,000 | $72,234 | $159,766 |
| 2019 | $1,804 | $230,000 | $41,914 | $188,086 |
| 2018 | $1,719 | $206,000 | $39,887 | $166,113 |
| 2017 | $1,521 | $169,000 | $36,755 | $132,245 |
| 2016 | $1,437 | $85,541 | $17,909 | $67,632 |
| 2015 | $1,370 | $83,642 | $17,909 | $65,733 |
| 2014 | $1,381 | $83,642 | $17,909 | $65,733 |
Source: Public Records
Map
Nearby Homes
- 2622 2125 W
- 2622 N 175 W
- 2632 2125 W
- 244 W 2575 N
- 350 W 2575 N
- 389 W 2575 N
- 428 W 2650 N
- 5902 S 1900 W
- 480 W 2650 N
- 484 W 2650 N
- 2512 N 475 W
- 2635 N 500 W Unit 45
- 2593 N 500 W Unit 56
- 2612 N 525 W
- 2486 N 690 W
- 2177 N 450 W
- 2101 N Main St Unit 205
- 2101 N Main St Unit 203
- 2101 N Main St Unit 409
- 5643 S 2200 W