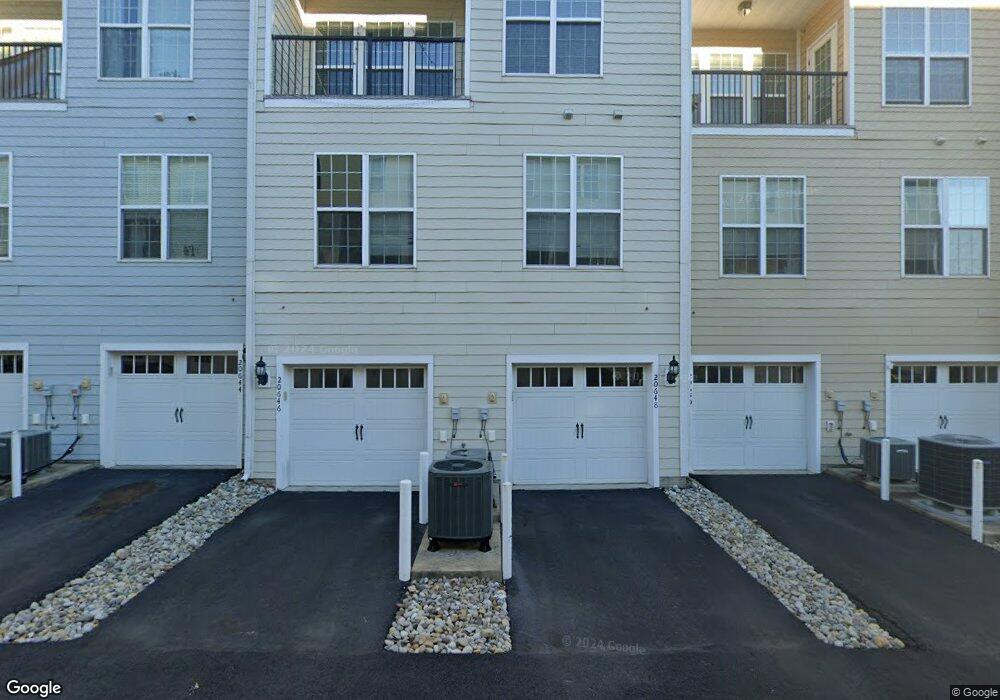
20648 Sibbald Square Unit 722 Ashburn, VA 20147
Estimated Value: $543,648 - $565,000
3
Beds
3
Baths
2,379
Sq Ft
$233/Sq Ft
Est. Value
About This Home
This home is located at 20648 Sibbald Square Unit 722, Ashburn, VA 20147 and is currently estimated at $555,162, approximately $233 per square foot. 20648 Sibbald Square Unit 722 is a home located in Loudoun County with nearby schools including Belmont Station Elementary School, Trailside Middle School, and Stone Bridge High.
Ownership History
Date
Name
Owned For
Owner Type
Purchase Details
Closed on
Jun 4, 2021
Sold by
Perez Ricardo and Nefsky-Oerez Meghan M
Bought by
Lee Louie and Asan Diego Cristina
Current Estimated Value
Home Financials for this Owner
Home Financials are based on the most recent Mortgage that was taken out on this home.
Original Mortgage
$418,500
Outstanding Balance
$378,900
Interest Rate
2.9%
Mortgage Type
Purchase Money Mortgage
Estimated Equity
$176,262
Purchase Details
Closed on
Mar 10, 2014
Sold by
Ridgley Eric A
Bought by
Perez Ricardo
Home Financials for this Owner
Home Financials are based on the most recent Mortgage that was taken out on this home.
Original Mortgage
$374,015
Interest Rate
4.32%
Mortgage Type
New Conventional
Purchase Details
Closed on
Jul 26, 2011
Sold by
Centex Homes
Bought by
Ridgley Eric A
Home Financials for this Owner
Home Financials are based on the most recent Mortgage that was taken out on this home.
Original Mortgage
$335,465
Interest Rate
4.52%
Mortgage Type
VA
Create a Home Valuation Report for This Property
The Home Valuation Report is an in-depth analysis detailing your home's value as well as a comparison with similar homes in the area
Home Values in the Area
Average Home Value in this Area
Purchase History
| Date | Buyer | Sale Price | Title Company |
|---|---|---|---|
| Lee Louie | $465,000 | Attorney | |
| Perez Ricardo | $393,700 | -- | |
| Ridgley Eric A | $328,405 | -- |
Source: Public Records
Mortgage History
| Date | Status | Borrower | Loan Amount |
|---|---|---|---|
| Open | Lee Louie | $418,500 | |
| Previous Owner | Perez Ricardo | $374,015 | |
| Previous Owner | Ridgley Eric A | $335,465 |
Source: Public Records
Tax History
| Year | Tax Paid | Tax Assessment Tax Assessment Total Assessment is a certain percentage of the fair market value that is determined by local assessors to be the total taxable value of land and additions on the property. | Land | Improvement |
|---|---|---|---|---|
| 2025 | $4,199 | $521,580 | $170,000 | $351,580 |
| 2024 | $4,600 | $531,800 | $170,000 | $361,800 |
| 2023 | $4,309 | $492,400 | $170,000 | $322,400 |
| 2022 | $3,937 | $442,400 | $120,000 | $322,400 |
| 2021 | $3,889 | $396,800 | $90,000 | $306,800 |
| 2020 | $3,970 | $383,620 | $90,000 | $293,620 |
| 2019 | $3,929 | $375,940 | $80,000 | $295,940 |
| 2018 | $3,878 | $357,440 | $80,000 | $277,440 |
| 2017 | $3,943 | $350,500 | $80,000 | $270,500 |
| 2016 | $4,040 | $352,820 | $0 | $0 |
| 2015 | $4,188 | $289,000 | $0 | $289,000 |
| 2014 | $3,995 | $265,880 | $0 | $265,880 |
Source: Public Records
Map
Nearby Homes
- 42692 Keiller Terrace
- 43740 Transit Square
- SKYE Plan at Goose Creek Village
- HARRIDAN Plan at Goose Creek Village
- 42662 Darala Dr
- 20867 Murry Falls Terrace Unit 195
- 20867 Murry Falls Terrace
- 20869 Murry Falls Terrace
- 20871 Murry Falls Terrace
- 20871 Murry Falls Terrace Unit 197
- 20873 Murry Falls Terrace
- 20875 Murry Falls Terrace
- 20877 Murry Falls Terrace
- 20879 Murry Falls Terrace
- 20881 Murry Falls Terrace
- 20885 Murry Falls Terrace
- 20887 Murry Falls Terrace
- 42649 Hearford Ln
- 20889 Murry Falls Terrace
- 20891 Murry Falls Terrace
- 20648 Sibbald Square
- 20650 Sibbald Square
- 20646 Sibbald Square
- 20646 Sibbald Square Unit 1H
- 20644 Sibbald Square
- 20652 Sibbald Square
- 20642 Sibbald Square
- 20634 Sibbald Square Unit 1422
- 20634 Sibbald Square Unit 1122
- 20634 Sibbald Square
- 20632 Sibbald Square
- 20630 Sibbald Square
- 20640 Sibbald Square
- 20654 Sibbald Square
- 20638 Sibbald Square
- 20638 Sibbald Square
- 20656 Sibbald Square
- 20647 Sibbald Square
- 20657 Sibbald Square Unit 321
- 20657 Sibbald Square
Your Personal Tour Guide
Ask me questions while you tour the home.