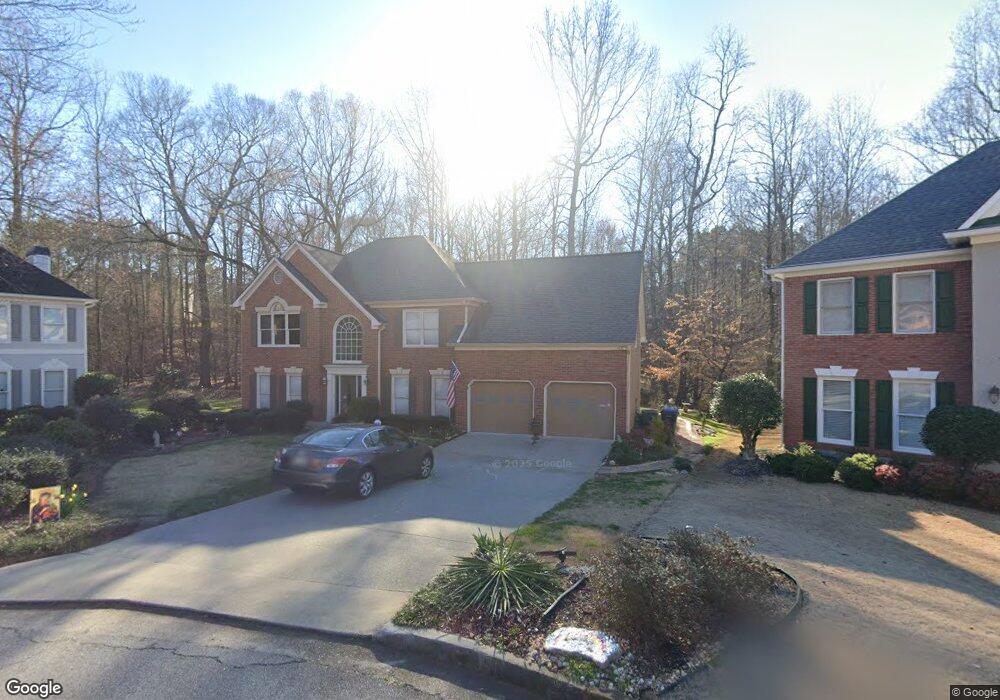
2065 Peachbluff Dr Duluth, GA 30097
Estimated Value: $535,000 - $604,000
4
Beds
3
Baths
2,660
Sq Ft
$209/Sq Ft
Est. Value
About This Home
This home is located at 2065 Peachbluff Dr, Duluth, GA 30097 and is currently estimated at $556,211, approximately $209 per square foot. 2065 Peachbluff Dr is a home located in Gwinnett County with nearby schools including Burnette Elementary School, Hull Middle School, and Peachtree Ridge High School.
Ownership History
Date
Name
Owned For
Owner Type
Purchase Details
Closed on
Aug 31, 2006
Sold by
Shepard Robert F
Bought by
Rodriguez Ruben and Rodriguez Diana B
Current Estimated Value
Home Financials for this Owner
Home Financials are based on the most recent Mortgage that was taken out on this home.
Original Mortgage
$55,300
Outstanding Balance
$21,535
Interest Rate
6.52%
Mortgage Type
Unknown
Estimated Equity
$534,676
Purchase Details
Closed on
Apr 22, 2004
Sold by
Church Jeffrey B and Church Pamela
Bought by
Shepard Robert F
Home Financials for this Owner
Home Financials are based on the most recent Mortgage that was taken out on this home.
Original Mortgage
$252,500
Interest Rate
5.38%
Mortgage Type
New Conventional
Purchase Details
Closed on
Mar 9, 1995
Sold by
Traton Corp Of Ga
Bought by
Church Jeffrey B Pamela W
Create a Home Valuation Report for This Property
The Home Valuation Report is an in-depth analysis detailing your home's value as well as a comparison with similar homes in the area
Home Values in the Area
Average Home Value in this Area
Purchase History
| Date | Buyer | Sale Price | Title Company |
|---|---|---|---|
| Rodriguez Ruben | $276,500 | -- | |
| Shepard Robert F | $252,500 | -- | |
| Church Jeffrey B Pamela W | $155,400 | -- |
Source: Public Records
Mortgage History
| Date | Status | Borrower | Loan Amount |
|---|---|---|---|
| Open | Rodriguez Ruben | $55,300 | |
| Open | Rodriguez Ruben | $221,200 | |
| Previous Owner | Shepard Robert F | $252,500 | |
| Closed | Church Jeffrey B Pamela W | $0 |
Source: Public Records
Tax History Compared to Growth
Tax History
| Year | Tax Paid | Tax Assessment Tax Assessment Total Assessment is a certain percentage of the fair market value that is determined by local assessors to be the total taxable value of land and additions on the property. | Land | Improvement |
|---|---|---|---|---|
| 2025 | $1,463 | $194,840 | $48,240 | $146,600 |
| 2024 | $1,462 | $185,280 | $40,000 | $145,280 |
| 2023 | $1,462 | $180,680 | $40,000 | $140,680 |
| 2022 | $0 | $148,800 | $32,000 | $116,800 |
| 2021 | $3,239 | $118,440 | $26,000 | $92,440 |
| 2020 | $3,239 | $118,440 | $26,000 | $92,440 |
| 2019 | $3,239 | $118,440 | $26,000 | $92,440 |
| 2018 | $3,630 | $109,080 | $22,400 | $86,680 |
| 2016 | $0 | $98,160 | $20,000 | $78,160 |
| 2015 | $3,239 | $88,560 | $15,600 | $72,960 |
| 2014 | -- | $88,560 | $15,600 | $72,960 |
Source: Public Records
Map
Nearby Homes
- 3760 Peachbluff Ct Unit 2
- 2051 Glenview Park Cir
- 2207 Parkside Glen View
- 1758 Glenview Park Cir
- 3899 Glenview Club Ln
- 3920 Glenview Club Ln
- 2005 Hailston Dr
- 2008 Hailston Dr
- 4290 Canterbury Walk Dr
- 2070 Hailston Dr
- 2052 Tallapoosa Dr
- 2107 Hailston Dr
- 2122 Hailston Dr
- 1850 Noblin Ridge Way
- 1894 Point River Dr
- 1980 Chattahoochee Dr
- 2055 Peachbluff Dr Unit 2
- 2075 Peachbluff Dr
- 2070 Peachbluff Dr
- 2045 Peachbluff Dr
- 2050 Peachbluff Dr Unit 2
- 2040 Peachbluff Dr
- 2035 Peachbluff Dr
- 2030 Peachbluff Dr
- 3895 Canterbury Walk Dr Unit 3895
- 3895 Canterbury Walk Dr
- 3895 Canterbury Walk Dr Unit 1
- 3895 Canterbury Walk Dr Unit 137
- 3905 Canterbury Walk Dr
- 2025 Peachbluff Dr
- 3885 Canterbury Walk Dr Unit 1
- 3692 Lance Bluff Ln
- 3682 Lance Bluff Ln Unit 2
- 3915 Canterbury Walk Dr
- 3835 Canterbury Walk Dr
- 3845 Canterbury Walk Dr Unit 1