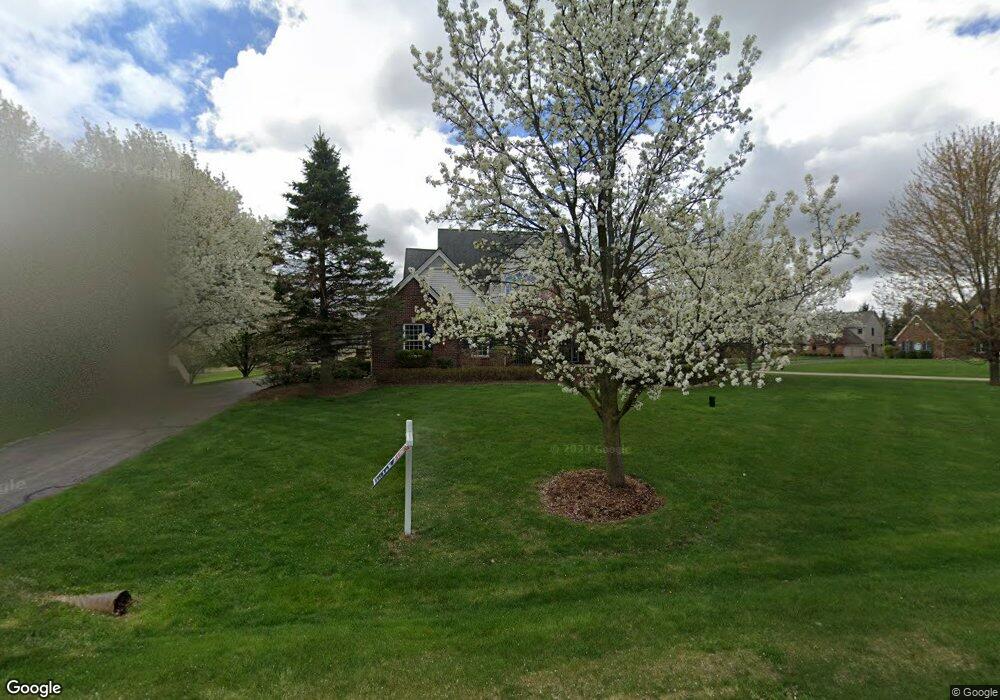
2065 Port Ave Unit 18 Ann Arbor, MI 48108
Estimated Value: $673,000 - $724,000
4
Beds
3
Baths
24,720
Sq Ft
$28/Sq Ft
Est. Value
About This Home
This home is located at 2065 Port Ave Unit 18, Ann Arbor, MI 48108 and is currently estimated at $692,279, approximately $28 per square foot. 2065 Port Ave Unit 18 is a home located in Washtenaw County with nearby schools including Harvest Elementary School, Heritage School, and Saline Middle School.
Ownership History
Date
Name
Owned For
Owner Type
Purchase Details
Closed on
May 24, 2023
Sold by
Kasikci Baris Can Cengiz and Tsimpanouli Maria Efstratia
Bought by
Kirca Ahmet Halil and Kirca Dilek
Current Estimated Value
Home Financials for this Owner
Home Financials are based on the most recent Mortgage that was taken out on this home.
Original Mortgage
$528,000
Outstanding Balance
$513,318
Interest Rate
6.39%
Mortgage Type
New Conventional
Estimated Equity
$178,961
Purchase Details
Closed on
Feb 27, 2018
Sold by
Jacobs Jon E and Jacobs Elizabeth D
Bought by
Efstratia Cengiz Kasikci Baris Can and Efstratia Tsimpanouli Maria
Home Financials for this Owner
Home Financials are based on the most recent Mortgage that was taken out on this home.
Original Mortgage
$300,000
Interest Rate
4.04%
Mortgage Type
New Conventional
Create a Home Valuation Report for This Property
The Home Valuation Report is an in-depth analysis detailing your home's value as well as a comparison with similar homes in the area
Home Values in the Area
Average Home Value in this Area
Purchase History
| Date | Buyer | Sale Price | Title Company |
|---|---|---|---|
| Kirca Ahmet Halil | $660,000 | American Title | |
| Kirca Ahmet Halil | $660,000 | American Title | |
| Efstratia Cengiz Kasikci Baris Can | $475,000 | None Available |
Source: Public Records
Mortgage History
| Date | Status | Borrower | Loan Amount |
|---|---|---|---|
| Open | Kirca Ahmet Halil | $528,000 | |
| Previous Owner | Efstratia Cengiz Kasikci Baris Can | $300,000 |
Source: Public Records
Tax History Compared to Growth
Tax History
| Year | Tax Paid | Tax Assessment Tax Assessment Total Assessment is a certain percentage of the fair market value that is determined by local assessors to be the total taxable value of land and additions on the property. | Land | Improvement |
|---|---|---|---|---|
| 2025 | $7,504 | $320,052 | $0 | $0 |
| 2024 | $7,292 | $262,249 | $0 | $0 |
| 2023 | $6,802 | $244,200 | $0 | $0 |
| 2022 | $9,439 | $235,400 | $0 | $0 |
| 2021 | $9,418 | $233,900 | $0 | $0 |
| 2020 | $9,037 | $231,900 | $0 | $0 |
| 2019 | $8,806 | $226,500 | $226,500 | $0 |
| 2018 | $7,440 | $223,900 | $0 | $0 |
| 2017 | $10,536 | $221,800 | $0 | $0 |
| 2016 | $8,622 | $184,554 | $0 | $0 |
| 2015 | -- | $184,002 | $0 | $0 |
| 2014 | -- | $178,253 | $0 | $0 |
| 2013 | -- | $178,253 | $0 | $0 |
Source: Public Records
Map
Nearby Homes
- 1660 Pond Shore Dr
- 888 Risdon Trail S
- 850 Kuss Dr
- 848 Kuss Dr
- 859 Risdon Trail S
- 838 Kuss Dr
- 853 Risdon Trail S
- 832 Kuss Dr
- 841 Risdon Trail S
- 846 Risdon Trail S
- 834 Risdon Trail S
- 751 Haywood Dr
- 709 Risdon Trail S
- 720 Risdon Trail S
- 606 Gretchen Ln
- 698 Gretchen Ln
- 696 Gretchen Ln
- 694 Gretchen Ln
- 612 Gretchen Ln
- 690 Gretchen Ln
- 2065 Port Ave
- 2043 Port Ave
- 6389 Vineyard Ave
- 6364 Vineyard Ave
- 6330 Vineyard Ave
- 2011 Port Ave
- 2064 Port Ave
- 0 Port Ave
- 2038 Port Ave
- 6390 Vineyard Ave Unit 22
- 6292 Vineyard Ave Unit 25
- 6399 Vineyard Ave Unit 20
- 6400 Vineyard Ave Unit 21
- 2010 Port Ave Unit 15
- 1712 Pond Shore Dr
- 1726 Pond Shore Dr
- 6266 Vineyard Ave
- 2063 Merlot Ct
- 2041 Merlot Ct
- 1698 Pond Shore Dr