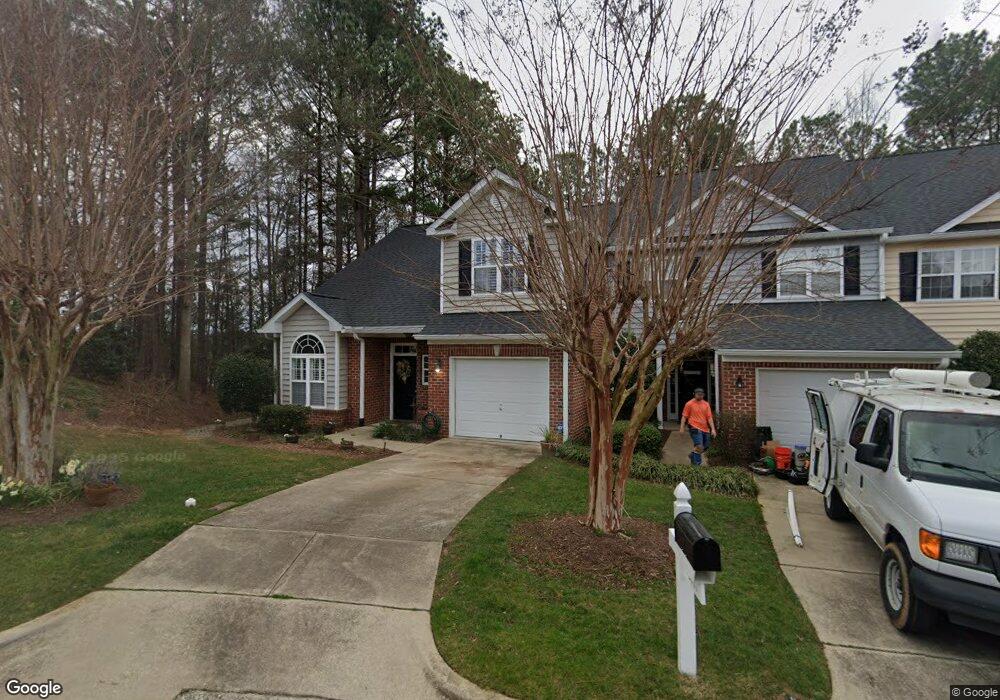
2065 White Pond Ct Apex, NC 27523
Beaver Creek NeighborhoodEstimated Value: $411,064 - $431,000
3
Beds
3
Baths
1,800
Sq Ft
$235/Sq Ft
Est. Value
About This Home
This home is located at 2065 White Pond Ct, Apex, NC 27523 and is currently estimated at $423,516, approximately $235 per square foot. 2065 White Pond Ct is a home located in Wake County with nearby schools including Turner Creek Elementary School, Salem Middle, and Green Level High School.
Ownership History
Date
Name
Owned For
Owner Type
Purchase Details
Closed on
Mar 4, 2022
Sold by
Lanni-Symonds and Steven
Bought by
Lanni Maria
Current Estimated Value
Home Financials for this Owner
Home Financials are based on the most recent Mortgage that was taken out on this home.
Original Mortgage
$67,500
Outstanding Balance
$54,471
Interest Rate
3.15%
Mortgage Type
New Conventional
Estimated Equity
$369,045
Purchase Details
Closed on
Aug 30, 2011
Sold by
Crow Beverly
Bought by
Lanni Symonds Maria
Home Financials for this Owner
Home Financials are based on the most recent Mortgage that was taken out on this home.
Original Mortgage
$156,000
Interest Rate
4.54%
Mortgage Type
New Conventional
Purchase Details
Closed on
Oct 10, 2003
Sold by
Walden Townes Inc
Bought by
Crow Beverly
Home Financials for this Owner
Home Financials are based on the most recent Mortgage that was taken out on this home.
Original Mortgage
$100,000
Interest Rate
6.45%
Mortgage Type
Unknown
Create a Home Valuation Report for This Property
The Home Valuation Report is an in-depth analysis detailing your home's value as well as a comparison with similar homes in the area
Home Values in the Area
Average Home Value in this Area
Purchase History
| Date | Buyer | Sale Price | Title Company |
|---|---|---|---|
| Lanni Maria | -- | Shoaf Law Firm Pa | |
| Lanni Symonds Maria | $195,000 | None Available | |
| Crow Beverly | $179,000 | -- |
Source: Public Records
Mortgage History
| Date | Status | Borrower | Loan Amount |
|---|---|---|---|
| Open | Lanni Maria | $67,500 | |
| Previous Owner | Lanni Symonds Maria | $156,000 | |
| Previous Owner | Crow Beverly | $100,000 |
Source: Public Records
Tax History Compared to Growth
Tax History
| Year | Tax Paid | Tax Assessment Tax Assessment Total Assessment is a certain percentage of the fair market value that is determined by local assessors to be the total taxable value of land and additions on the property. | Land | Improvement |
|---|---|---|---|---|
| 2025 | $3,953 | $450,452 | $150,000 | $300,452 |
| 2024 | $3,865 | $450,452 | $150,000 | $300,452 |
| 2023 | $3,020 | $273,467 | $50,000 | $223,467 |
| 2022 | $2,835 | $273,467 | $50,000 | $223,467 |
| 2021 | $2,727 | $273,467 | $50,000 | $223,467 |
| 2020 | $2,700 | $273,467 | $50,000 | $223,467 |
| 2019 | $2,424 | $211,642 | $40,000 | $171,642 |
| 2018 | $2,283 | $211,642 | $40,000 | $171,642 |
| 2017 | $2,126 | $211,642 | $40,000 | $171,642 |
| 2016 | $2,095 | $211,642 | $40,000 | $171,642 |
| 2015 | $2,140 | $211,015 | $40,000 | $171,015 |
| 2014 | -- | $211,015 | $40,000 | $171,015 |
Source: Public Records
Map
Nearby Homes
- 2004 Clydner Dr
- 1505 Poets Glade Dr
- 2101 White Pond Ct
- 2321 Walden Creek Dr
- 2317 Colony Woods Dr
- 772 Mirkwood Ave
- 2414 Bristers Spring Way
- 2314 Colony Woods Dr
- 1705 Pointe Crossing
- 2120 Grouse Ski Cir
- 2123 Grouse Ski Cir
- 763 Larkspur Bowl Way
- 2106 Grubstake St
- 2124 Grubstake St
- 1001 Drayman Place
- 760 Bachelor Gulch Way
- Nolen Plan at Prestwick
- Hutton Plan at Prestwick
- Continental Plan at Prestwick
- Summerford Plan at Prestwick
- 2071 White Pond Ct
- 2059 White Pond Ct
- 2073 White Pond Ct
- 2057 White Pond Ct
- 2055 White Pond Ct
- 2058 White Pond Ct
- 2083 White Pond Ct
- 2053 White Pond Ct
- 2056 White Pond Ct
- 2085 White Pond Ct
- 1510 Poets Glade Dr
- 2054 White Pond Ct
- 2051 White Pond Ct
- 1512 Poets Glade Dr
- 2087 White Pond Ct
- 1514 Poets Glade Dr
- 2046 White Pond Ct
- 2043 White Pond Ct
- 2044 White Pond Ct
- 2041 White Pond Ct