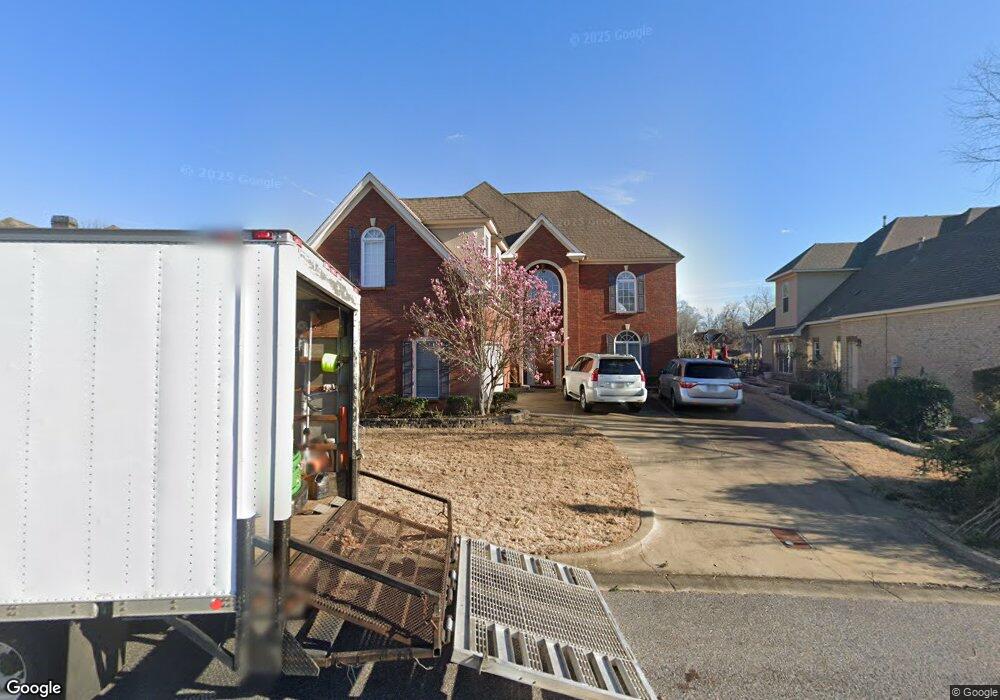
2065 Wyndgate Loop Montgomery, AL 36117
East Montgomery NeighborhoodEstimated Value: $435,000 - $440,000
3
Beds
2
Baths
3,073
Sq Ft
$142/Sq Ft
Est. Value
About This Home
This home is located at 2065 Wyndgate Loop, Montgomery, AL 36117 and is currently estimated at $437,839, approximately $142 per square foot. 2065 Wyndgate Loop is a home with nearby schools including Halcyon Elementary School, Johnnie R. Carr Middle School, and Park Crossing High School.
Ownership History
Date
Name
Owned For
Owner Type
Purchase Details
Closed on
Oct 20, 2021
Sold by
Mai Phi V
Bought by
Mai Phi V and Mai Di Khueng
Current Estimated Value
Purchase Details
Closed on
Aug 17, 2017
Sold by
Taylor Road Baptist Church
Bought by
Mai Phi and An Thang
Purchase Details
Closed on
Sep 22, 2015
Sold by
Mai Di Khuong
Bought by
Mai Phi
Purchase Details
Closed on
Dec 1, 2014
Sold by
Mai Phi V and Mai Lac H
Bought by
Mai Phi and Mai Di Khuong
Purchase Details
Closed on
Sep 18, 2002
Sold by
Lowder New Homes Inc
Bought by
Mai Phi V and Mai Lac H
Home Financials for this Owner
Home Financials are based on the most recent Mortgage that was taken out on this home.
Original Mortgage
$274,000
Interest Rate
6.3%
Create a Home Valuation Report for This Property
The Home Valuation Report is an in-depth analysis detailing your home's value as well as a comparison with similar homes in the area
Home Values in the Area
Average Home Value in this Area
Purchase History
| Date | Buyer | Sale Price | Title Company |
|---|---|---|---|
| Mai Phi V | -- | None Available | |
| Mai Phi | $90,000 | None Available | |
| Mai Phi | $168,000 | None Available | |
| Mai Phi | $169,650 | None Available | |
| Mai Phi V | -- | -- |
Source: Public Records
Mortgage History
| Date | Status | Borrower | Loan Amount |
|---|---|---|---|
| Previous Owner | Mai Phi V | $274,000 |
Source: Public Records
Tax History Compared to Growth
Tax History
| Year | Tax Paid | Tax Assessment Tax Assessment Total Assessment is a certain percentage of the fair market value that is determined by local assessors to be the total taxable value of land and additions on the property. | Land | Improvement |
|---|---|---|---|---|
| 2025 | $2,145 | $44,860 | $6,600 | $38,260 |
| 2024 | $2,111 | $44,160 | $6,600 | $37,560 |
| 2023 | $2,111 | $44,650 | $6,600 | $38,050 |
| 2022 | $1,326 | $37,430 | $6,600 | $30,830 |
| 2021 | $1,248 | $35,320 | $0 | $0 |
| 2020 | $1,261 | $35,680 | $6,600 | $29,080 |
| 2019 | $1,320 | $37,290 | $6,600 | $30,690 |
| 2018 | $1,342 | $36,760 | $6,600 | $30,160 |
| 2017 | $1,235 | $69,900 | $11,000 | $58,900 |
| 2014 | $1,198 | $33,930 | $6,880 | $27,050 |
| 2013 | -- | $34,590 | $6,880 | $27,710 |
Source: Public Records
Map
Nearby Homes
- 2221 Wyndgate Dr
- 2200 Wyndgate Dr
- 2230 Wyndgate Dr
- 8724 Old Marsh Way
- 8731 Old Marsh Way
- 7863 Lakeridge Dr
- 8573 W Hampton Ct
- 2300 Brookstone Dr
- 8416 Marsh Pointe Dr
- 8242 Marsh Pointe Dr
- 1960 Parkview Dr S
- 2300 Halcyon Blvd
- 2310 Halcyon Blvd
- 1957 Berry Chase Place
- 2229 Halcyon Downs Loop
- 8778 Marsh Ridge Dr
- 1536 Grantham Dr
- 1571 Mews Cross St
- 8132 Longneedle Place
- 8443 Guildhall St
- 2059 Wyndgate Loop
- 2071 Wyndgate Loop
- 2077 Wyndgate Loop
- 2053 Wyndgate Loop
- 2070 Wyndgate Loop
- 2076 Wyndgate Loop
- 2083 Wyndgate Loop
- 2047 Wyndgate Loop
- 2082 Wyndgate Loop
- 2034 Wyndgate Loop
- 2169 Wyndgate Loop
- 2028 Wyndgate Loop
- 2041 Wyndgate Loop
- 2022 Wyndgate Loop
- 2175 Wyndgate Loop
- 2107 Wyndgate Mews
- 2035 Wyndgate Loop
- 2174 Wyndgate Loop
- 2029 Wyndgate Loop
- 2016 Wyndgate Loop