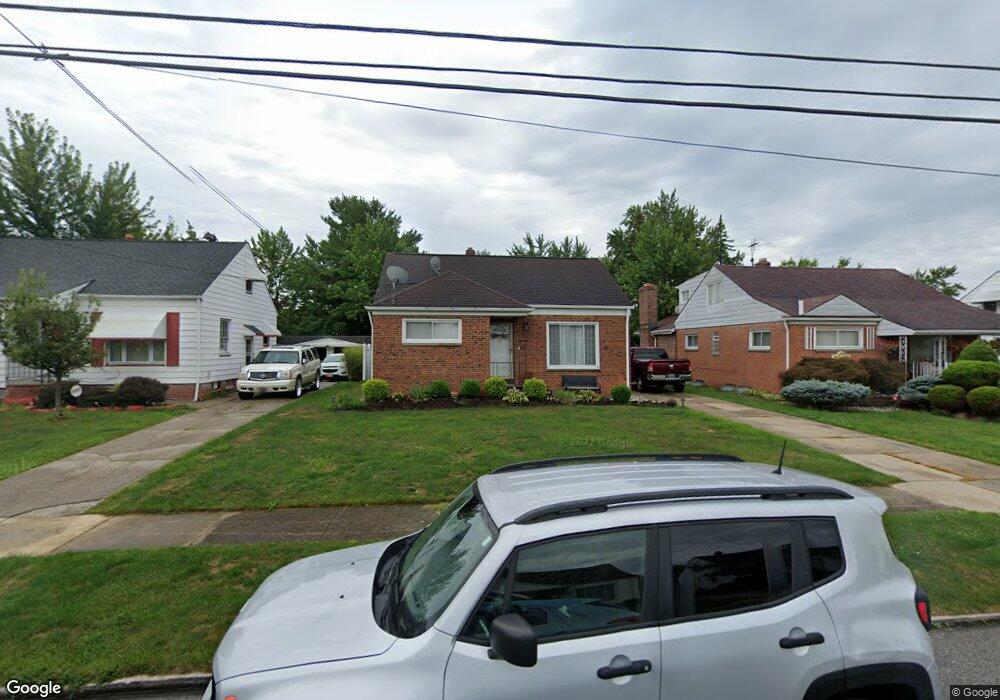
20652 Applegate Rd Maple Heights, OH 44137
Estimated Value: $126,000 - $134,000
3
Beds
1
Bath
1,222
Sq Ft
$107/Sq Ft
Est. Value
About This Home
This home is located at 20652 Applegate Rd, Maple Heights, OH 44137 and is currently estimated at $131,234, approximately $107 per square foot. 20652 Applegate Rd is a home located in Cuyahoga County with nearby schools including Abraham Lincoln Elementary School, Rockside/ J.F. Kennedy School, and Barack Obama School.
Ownership History
Date
Name
Owned For
Owner Type
Purchase Details
Closed on
May 24, 2001
Sold by
Pastor Joseph
Bought by
Perkins Eric L and Perkins Siluvina T
Current Estimated Value
Home Financials for this Owner
Home Financials are based on the most recent Mortgage that was taken out on this home.
Original Mortgage
$85,818
Outstanding Balance
$32,139
Interest Rate
7.07%
Mortgage Type
FHA
Estimated Equity
$99,095
Purchase Details
Closed on
Jun 15, 1988
Sold by
Pastor Joe
Bought by
Pastor Margaret
Purchase Details
Closed on
Feb 18, 1988
Sold by
Pastor Joe
Bought by
Pastor Joe
Purchase Details
Closed on
Oct 17, 1986
Sold by
Kurcsak Steve E
Bought by
Pastor Joe
Purchase Details
Closed on
Apr 3, 1986
Sold by
Kurcsak Margaret
Bought by
Kurcsak Steve E
Purchase Details
Closed on
Apr 1, 1983
Sold by
Kurcsak Steve and Kurcsak Margaret
Bought by
Kurcsak Margaret
Purchase Details
Closed on
Jan 1, 1975
Bought by
Kurcsak Steve and Kurcsak Margaret
Create a Home Valuation Report for This Property
The Home Valuation Report is an in-depth analysis detailing your home's value as well as a comparison with similar homes in the area
Home Values in the Area
Average Home Value in this Area
Purchase History
| Date | Buyer | Sale Price | Title Company |
|---|---|---|---|
| Perkins Eric L | $89,000 | Executive Title Agency Corp | |
| Pastor Margaret | -- | -- | |
| Pastor Joe | -- | -- | |
| Pastor Joe | $54,000 | -- | |
| Kurcsak Steve E | -- | -- | |
| Kurcsak Margaret | -- | -- | |
| Kurcsak Steve | -- | -- |
Source: Public Records
Mortgage History
| Date | Status | Borrower | Loan Amount |
|---|---|---|---|
| Open | Perkins Eric L | $85,818 |
Source: Public Records
Tax History
| Year | Tax Paid | Tax Assessment Tax Assessment Total Assessment is a certain percentage of the fair market value that is determined by local assessors to be the total taxable value of land and additions on the property. | Land | Improvement |
|---|---|---|---|---|
| 2024 | $3,728 | $41,650 | $7,000 | $34,650 |
| 2023 | $3,016 | $28,980 | $4,620 | $24,360 |
| 2022 | $3,005 | $28,980 | $4,620 | $24,360 |
| 2021 | $3,208 | $28,980 | $4,620 | $24,360 |
| 2020 | $2,729 | $21,950 | $3,500 | $18,450 |
| 2019 | $2,715 | $62,700 | $10,000 | $52,700 |
| 2018 | $2,638 | $21,950 | $3,500 | $18,450 |
| 2017 | $2,770 | $22,090 | $3,470 | $18,620 |
| 2016 | $2,678 | $22,090 | $3,470 | $18,620 |
| 2015 | $2,697 | $22,090 | $3,470 | $18,620 |
| 2014 | $2,697 | $24,260 | $3,820 | $20,440 |
Source: Public Records
Map
Nearby Homes
- 339 Grand Blvd
- 19113 Watercrest Ave
- 123 Willard Ave
- 54 Willard Ave
- 419 Center Rd
- 66 Hubbell Way
- 58 Hubbell Way
- 62 Hubbell Way
- 54 Hubbell Way
- 0 Hubbell Cir
- 61 Hubbell Way
- 57 Hubbell Way
- 21202 Gardenview Dr
- 21607 Libby Rd
- 20806 Clare Ave
- 19289 Stafford Ave
- 5424 Fairtree Rd
- 21202 Hillgrove Ave
- 131 Noran Cir
- 5147 Warrensville Center Rd
- 20648 Applegate Rd
- 20656 Applegate Rd
- 20644 Applegate Rd
- 20660 Applegate Rd
- 20651 Donny Brook Rd
- 20655 Donny Brook Rd
- 20647 Donny Brook Rd
- 20640 Applegate Rd
- 20664 Applegate Rd
- 20659 Donny Brook Rd
- 20643 Donny Brook Rd
- 20647 Applegate Rd
- 20651 Applegate Rd
- 20655 Applegate Rd
- 20636 Applegate Rd
- 20659 Applegate Rd
- 20639 Donny Brook Rd
- 20638 Bowling Green Rd
- 20663 Donny Brook Rd
- 20668 Applegate Rd
Your Personal Tour Guide
Ask me questions while you tour the home.