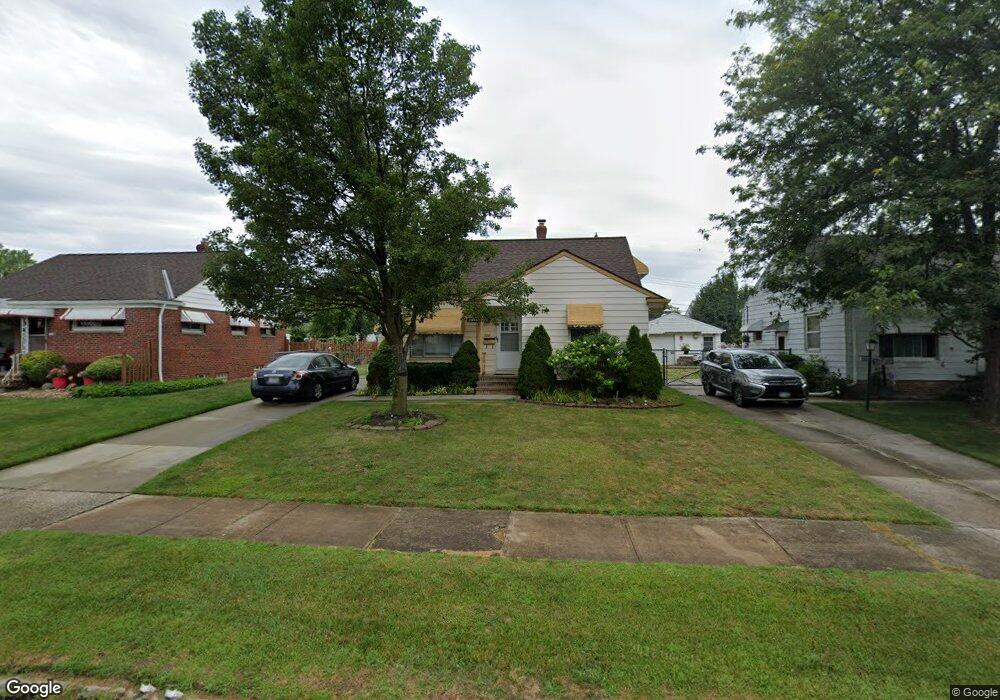
20659 Applegate Rd Maple Heights, OH 44137
Estimated Value: $102,000 - $140,000
3
Beds
1
Bath
1,222
Sq Ft
$99/Sq Ft
Est. Value
About This Home
This home is located at 20659 Applegate Rd, Maple Heights, OH 44137 and is currently estimated at $120,635, approximately $98 per square foot. 20659 Applegate Rd is a home located in Cuyahoga County with nearby schools including Abraham Lincoln Elementary School, Rockside/ J.F. Kennedy School, and Barack Obama School.
Ownership History
Date
Name
Owned For
Owner Type
Purchase Details
Closed on
Jul 23, 2021
Sold by
Masarik Emil and Roeckelein Lois H
Bought by
Roeckelein Lois H and Friedman Alexis
Current Estimated Value
Purchase Details
Closed on
Jun 30, 2009
Sold by
Friedman Astonna Masarik and Friedman Roy J
Bought by
Masarik Emil and Roeckelein Lois H
Purchase Details
Closed on
Jun 26, 2009
Sold by
Sigmund April
Bought by
Masarik Astonna and Masarik Charise
Purchase Details
Closed on
Jan 11, 1999
Sold by
Masarik Sheila
Bought by
Masarik Astonna M
Purchase Details
Closed on
Dec 2, 1993
Sold by
Masarik John
Bought by
Sigmund April
Purchase Details
Closed on
Oct 24, 1984
Sold by
Sedlak Donald J
Bought by
Masarik John
Purchase Details
Closed on
Feb 10, 1981
Sold by
Donald Sedlak
Bought by
Sedlak Donald J
Purchase Details
Closed on
Nov 7, 1980
Sold by
Sedlak Donald
Bought by
Donald Sedlak
Purchase Details
Closed on
Mar 18, 1980
Sold by
Sedlak Eliz
Bought by
Sedlak Donald
Purchase Details
Closed on
Jan 1, 1975
Bought by
Sedlak Eliz
Create a Home Valuation Report for This Property
The Home Valuation Report is an in-depth analysis detailing your home's value as well as a comparison with similar homes in the area
Home Values in the Area
Average Home Value in this Area
Purchase History
| Date | Buyer | Sale Price | Title Company |
|---|---|---|---|
| Roeckelein Lois H | $27,500 | None Available | |
| Masarik Emil | $86,900 | Attorney | |
| Masarik Astonna | -- | Attorney | |
| Masarik Astonna M | -- | -- | |
| Sigmund April | -- | -- | |
| Masarik John | $43,500 | -- | |
| Sedlak Donald J | -- | -- | |
| Donald Sedlak | $49,000 | -- | |
| Sedlak Donald | -- | -- | |
| Sedlak Eliz | -- | -- |
Source: Public Records
Tax History Compared to Growth
Tax History
| Year | Tax Paid | Tax Assessment Tax Assessment Total Assessment is a certain percentage of the fair market value that is determined by local assessors to be the total taxable value of land and additions on the property. | Land | Improvement |
|---|---|---|---|---|
| 2024 | $3,646 | $40,250 | $7,560 | $32,690 |
| 2023 | $2,721 | $25,420 | $5,010 | $20,410 |
| 2022 | $2,711 | $25,410 | $5,010 | $20,410 |
| 2021 | $2,954 | $25,410 | $5,010 | $20,410 |
| 2020 | $2,522 | $19,250 | $3,780 | $15,470 |
| 2019 | $2,507 | $55,000 | $10,800 | $44,200 |
| 2018 | $2,494 | $19,250 | $3,780 | $15,470 |
| 2017 | $2,244 | $16,560 | $3,750 | $12,810 |
| 2016 | $2,167 | $16,560 | $3,750 | $12,810 |
| 2015 | $2,168 | $16,560 | $3,750 | $12,810 |
| 2014 | $2,168 | $18,200 | $4,130 | $14,070 |
Source: Public Records
Map
Nearby Homes
- 20625 Centuryway Rd
- 20732 Applegate Rd
- 20737 Bowling Green Rd
- 33 Meadowgate Blvd
- 339 Grand Blvd
- 19113 Watercrest Ave
- 123 Willard Ave
- 54 Willard Ave
- 419 Center Rd
- 66 Hubbell Way
- 58 Hubbell Way
- 62 Hubbell Way
- 54 Hubbell Way
- 0 Hubbell Cir
- 19812 Stockton Ave
- 21607 Libby Rd
- 61 Hubbell Way
- 57 Hubbell Way
- 20806 Clare Ave
- 19289 Stafford Ave
- 20663 Applegate Rd
- 20655 Applegate Rd
- 20651 Applegate Rd
- 20667 Applegate Rd
- 20666 Bowling Green Rd
- 20662 Bowling Green Rd
- 20658 Bowling Green Rd
- 20670 Bowling Green Rd
- 20671 Applegate Rd
- 20647 Applegate Rd
- 20660 Applegate Rd
- 20656 Applegate Rd
- 20654 Bowling Green Rd
- 20664 Applegate Rd
- 20674 Bowling Green Rd
- 20652 Applegate Rd
- 20675 Applegate Rd
- 20668 Applegate Rd
- 20650 Bowling Green Rd
- 20648 Applegate Rd