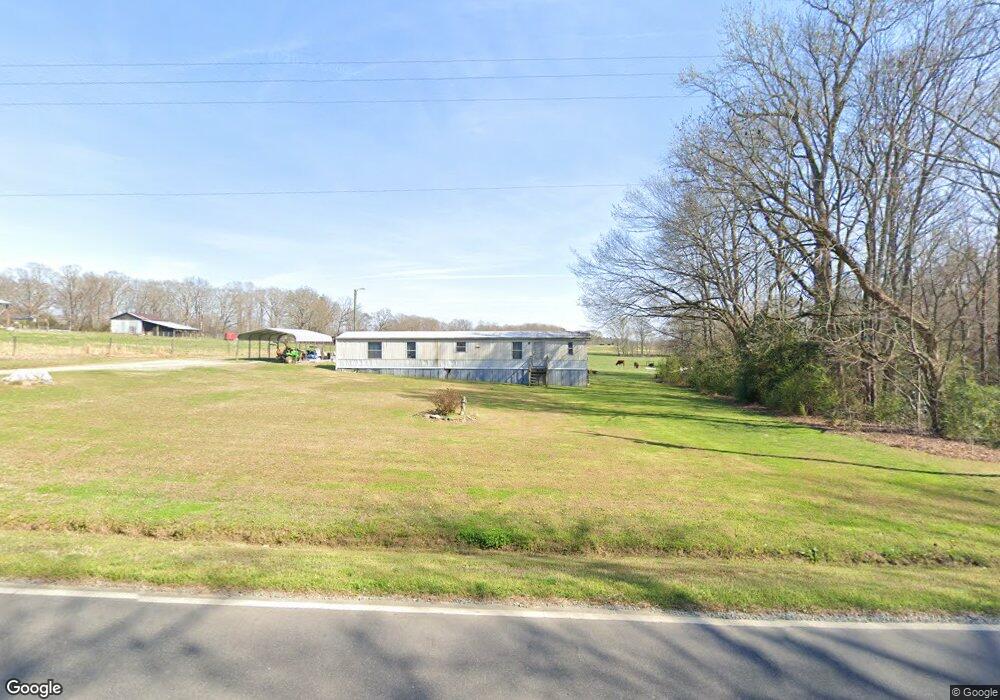
2066 Silk Hope Lindley Mill Rd Pittsboro, NC 27312
Estimated Value: $256,708 - $428,000
--
Bed
--
Bath
924
Sq Ft
$379/Sq Ft
Est. Value
About This Home
This home is located at 2066 Silk Hope Lindley Mill Rd, Pittsboro, NC 27312 and is currently estimated at $350,569, approximately $379 per square foot. 2066 Silk Hope Lindley Mill Rd is a home located in Chatham County with nearby schools including Silk Hope School and Jordan Matthews High.
Create a Home Valuation Report for This Property
The Home Valuation Report is an in-depth analysis detailing your home's value as well as a comparison with similar homes in the area
Home Values in the Area
Average Home Value in this Area
Tax History Compared to Growth
Tax History
| Year | Tax Paid | Tax Assessment Tax Assessment Total Assessment is a certain percentage of the fair market value that is determined by local assessors to be the total taxable value of land and additions on the property. | Land | Improvement |
|---|---|---|---|---|
| 2025 | $1,426 | $173,422 | $171,892 | $1,530 |
| 2024 | $925 | $112,494 | $107,134 | $5,360 |
| 2023 | $862 | $112,494 | $107,134 | $5,360 |
| 2022 | $966 | $112,494 | $107,134 | $5,360 |
| 2021 | $532 | $112,494 | $107,134 | $5,360 |
| 2020 | $654 | $110,811 | $101,541 | $9,270 |
| 2019 | $954 | $110,811 | $101,541 | $9,270 |
| 2018 | $908 | $110,811 | $101,541 | $9,270 |
| 2017 | $897 | $110,811 | $101,541 | $9,270 |
| 2016 | $1,028 | $128,611 | $119,461 | $9,150 |
| 2015 | $1,012 | $128,511 | $119,461 | $9,050 |
| 2014 | $1,012 | $128,511 | $119,461 | $9,050 |
| 2013 | -- | $128,511 | $119,461 | $9,050 |
Source: Public Records
Map
Nearby Homes
- 264 Wade Harris Rd
- 00 Epps Clark Rd
- 754 & 0 Epps Clark Rd
- 754 Epps Clark Rd
- 220 Epps Clark Rd
- 5545 Silk Hope Gum Springs Rd
- 5491 Silk Hope Gum Springs Rd
- 2892 Silk Hope Liberty Rd
- 144g Celebrity Dairy Way
- 0 Henderson Tanyard Rd Unit 10112548
- 0 Henderson Tanyard Rd Unit 100522009
- 2900 Quakenbush Rd
- 4018 Moon Lindley Rd
- 8024 Bird Dog Dr
- 0 Pete Thomas Rd
- 1565 Bowers Store Rd
- 0 Bailey Duncan Rd
- 7587 Siler City Snow Camp Rd
- 292 Choice Trail
- 8205 Old Switchboard Rd
- 2134 Silk Hope Lindley Mill Rd
- 1970 Silk Hope Lindley Mill Rd
- 2168 Silk Hope Lindley Mill Rd
- 1941 Silk Hope Lindley Mill Rd
- 37 Elbert Hardee Ln
- 2210 Silk Hope Lindley Mill Rd
- 1855 Silk Hope Lindley Mill Rd
- 1920 Silk Hope Lindley Mill Rd
- 0 Silk Hope Lindley Mill Rd Unit None TR1742595
- 0 Silk Hope Lindley Mill Rd Unit 492526
- 0 Silk Hope Lindley Mill Rd Unit TR1816081
- 0 Silk Hope Lindley Mill Rd Unit None TR1857966
- 0 Silk Hope Lindley Mill Rd Unit None 1742595
- 0 Silk Hope Lindley Mill Rd Unit None
- 2400 Silk Hope Lindley Mill Rd
- 2423 Silk Hope Lindley Mill Rd
- 375 Wade Harris Rd
- 2515 van Thomas Rd
- 2555 Silk Hope Lindley Mill Rd
- 2600 van Thomas Rd