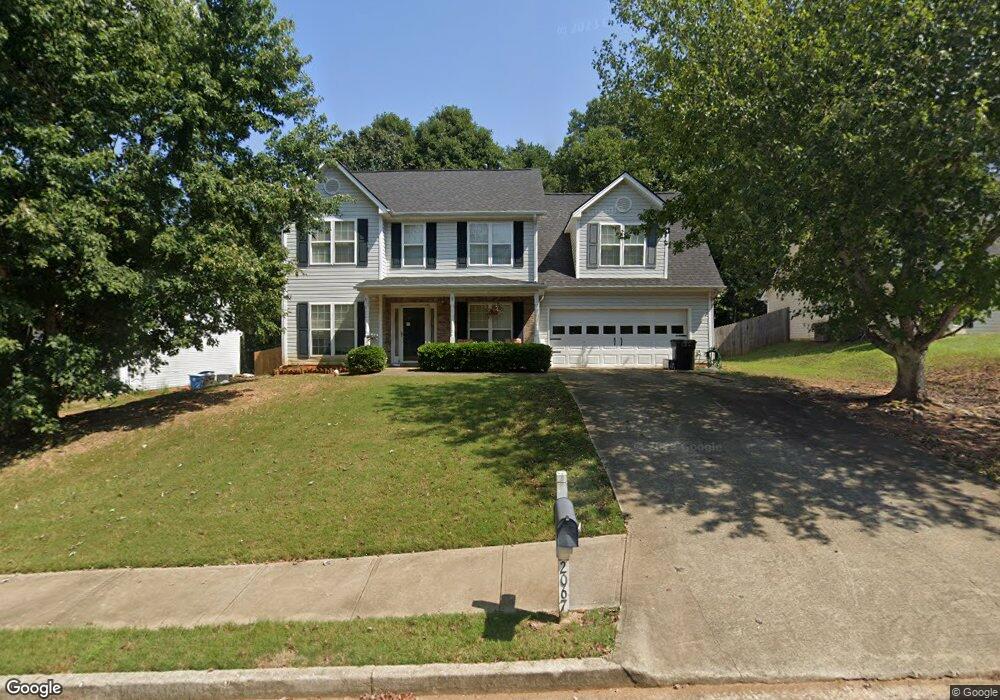
2067 Alcovy Trace Way Lawrenceville, GA 30045
Estimated Value: $343,000 - $374,604
4
Beds
3
Baths
2,362
Sq Ft
$154/Sq Ft
Est. Value
About This Home
This home is located at 2067 Alcovy Trace Way, Lawrenceville, GA 30045 and is currently estimated at $363,901, approximately $154 per square foot. 2067 Alcovy Trace Way is a home located in Gwinnett County with nearby schools including Alcova Elementary School, Dacula Middle School, and Dacula High School.
Ownership History
Date
Name
Owned For
Owner Type
Purchase Details
Closed on
Apr 1, 2011
Sold by
Hud & Housing Of Urban Dev
Bought by
Cobb Billy G and Cobb Miya D
Current Estimated Value
Home Financials for this Owner
Home Financials are based on the most recent Mortgage that was taken out on this home.
Original Mortgage
$99,990
Outstanding Balance
$68,323
Interest Rate
4.75%
Mortgage Type
FHA
Estimated Equity
$295,578
Purchase Details
Closed on
Sep 1, 2009
Sold by
Edwards Anthony C and Edwards Michelle J
Bought by
Chase Hm Fin Llc
Purchase Details
Closed on
Jul 13, 2001
Sold by
Edwards Michelle J
Bought by
Edwards Michelle J and Edwards Anthony C
Home Financials for this Owner
Home Financials are based on the most recent Mortgage that was taken out on this home.
Original Mortgage
$145,350
Interest Rate
7.1%
Mortgage Type
FHA
Create a Home Valuation Report for This Property
The Home Valuation Report is an in-depth analysis detailing your home's value as well as a comparison with similar homes in the area
Home Values in the Area
Average Home Value in this Area
Purchase History
| Date | Buyer | Sale Price | Title Company |
|---|---|---|---|
| Cobb Billy G | $98,000 | -- | |
| Chase Hm Fin Llc | $153,047 | -- | |
| Hud-Housing Of Urban Dev | -- | -- | |
| Chase Hm Fin Llc | $153,047 | -- | |
| Edwards Michelle J | -- | -- | |
| Edwards Michelle J | $147,700 | -- |
Source: Public Records
Mortgage History
| Date | Status | Borrower | Loan Amount |
|---|---|---|---|
| Open | Cobb Billy G | $99,990 | |
| Previous Owner | Edwards Michelle J | $145,350 |
Source: Public Records
Tax History Compared to Growth
Tax History
| Year | Tax Paid | Tax Assessment Tax Assessment Total Assessment is a certain percentage of the fair market value that is determined by local assessors to be the total taxable value of land and additions on the property. | Land | Improvement |
|---|---|---|---|---|
| 2025 | $4,011 | $136,720 | $30,000 | $106,720 |
| 2024 | $3,956 | $127,960 | $26,400 | $101,560 |
| 2023 | $3,956 | $154,040 | $30,000 | $124,040 |
| 2022 | $4,023 | $133,000 | $27,200 | $105,800 |
| 2021 | $3,261 | $94,120 | $18,000 | $76,120 |
| 2020 | $3,282 | $94,120 | $18,000 | $76,120 |
| 2019 | $3,036 | $87,400 | $18,000 | $69,400 |
| 2018 | $3,033 | $77,560 | $15,600 | $61,960 |
| 2016 | $2,562 | $63,640 | $13,600 | $50,040 |
| 2015 | $2,213 | $53,040 | $8,800 | $44,240 |
| 2014 | -- | $53,040 | $8,800 | $44,240 |
Source: Public Records
Map
Nearby Homes
- 1896 Alcovy Trace Way Unit 2
- 1897 Alcovy Trace Way Unit 2
- 2159 Redfern Rd
- 1400 Alcovy Rd SE
- 667 Alcovy Forest Dr
- 320 Little Creek Rd
- 1502 Sir Knights Way
- 1125 Campbell Pine Trail
- 72 Fern Walk
- 926 Red Wolf Ct
- 1821 Lily Valley Dr
- 1616 Little Creek Dr
- 1896 Charcoal Ives Rd
- 153 Fern Walk
- 855 Pensive Run
- 2479 Mitford Ct
- 2057 Alcovy Trace Way
- 2706 Alcovy Trace Way
- 2047 Alcovy Trace Way Unit 3
- 2087 Alcovy Trace Way
- 2066 Alcovy Trace Way
- 2076 Alcovy Trace Way
- 2056 Alcovy Trace Way
- 2037 Alcovy Trace Way Unit 3
- 2037 Alcovy Trace Way
- 2046 Alcovy Trace Way Unit 3
- 2053 Alcovy Trace Way
- 2086 Alcovy Trace Way
- 2036 Alcovy Trace Way Unit 3
- 2027 Alcovy Trace Way
- 2026 Alcovy Trace Way Unit 3
- 2017 Alcovy Trace Way
- 486 Alcovy Park Dr
- 2016 Alcovy Trace Way
- 2007 Alcovy Trace Way
- 496 Alcovy Park Dr