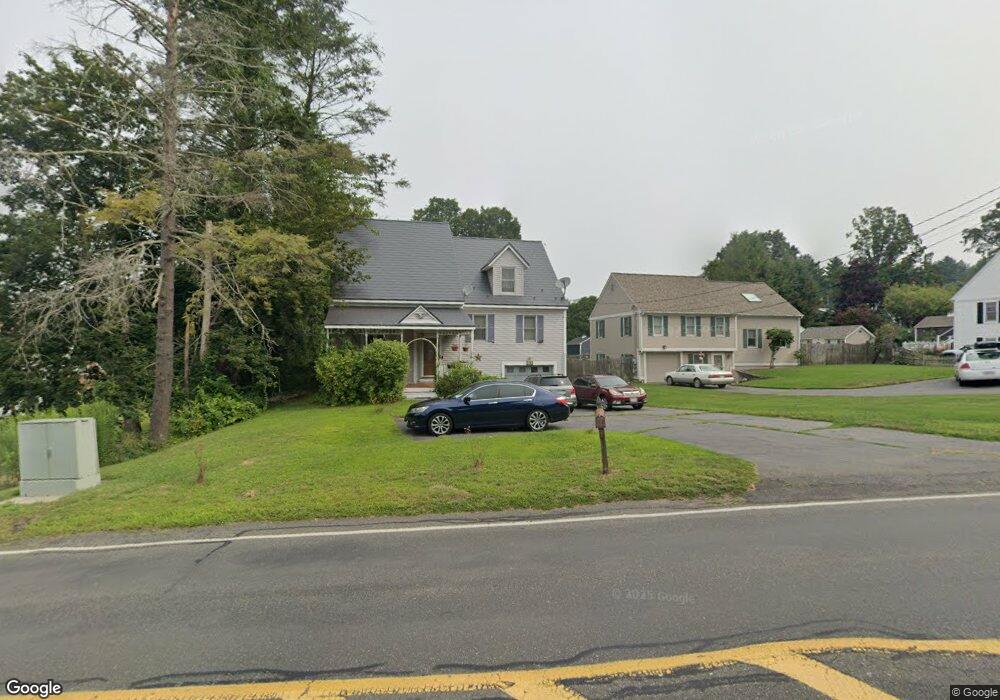
2067 Allen St Springfield, MA 01118
Sixteen Acres NeighborhoodEstimated Value: $324,000 - $482,000
3
Beds
2
Baths
2,300
Sq Ft
$170/Sq Ft
Est. Value
About This Home
This home is located at 2067 Allen St, Springfield, MA 01118 and is currently estimated at $391,402, approximately $170 per square foot. 2067 Allen St is a home located in Hampden County with nearby schools including Daniel B Brunton, M Marcus Kiley Middle, and Springfield High School of Science and Technology.
Ownership History
Date
Name
Owned For
Owner Type
Purchase Details
Closed on
Jul 29, 2011
Sold by
Manarite Arthur F and Manarite Mary F
Bought by
Cowan Howard R and Cowan Elaine F
Current Estimated Value
Home Financials for this Owner
Home Financials are based on the most recent Mortgage that was taken out on this home.
Original Mortgage
$154,000
Outstanding Balance
$60,700
Interest Rate
4.52%
Mortgage Type
Purchase Money Mortgage
Estimated Equity
$330,702
Purchase Details
Closed on
Jul 26, 2002
Sold by
Nehmer David L and Nehmer Trinda L
Bought by
Manarite Arthur F and Manarite Mary F
Purchase Details
Closed on
Sep 25, 1992
Sold by
Rockland Bldrs
Bought by
Nehmer David L and Nehmer Trinda L
Home Financials for this Owner
Home Financials are based on the most recent Mortgage that was taken out on this home.
Original Mortgage
$97,000
Interest Rate
7.9%
Mortgage Type
Purchase Money Mortgage
Create a Home Valuation Report for This Property
The Home Valuation Report is an in-depth analysis detailing your home's value as well as a comparison with similar homes in the area
Home Values in the Area
Average Home Value in this Area
Purchase History
| Date | Buyer | Sale Price | Title Company |
|---|---|---|---|
| Cowan Howard R | $192,500 | -- | |
| Manarite Arthur F | $168,000 | -- | |
| Nehmer David L | $113,500 | -- |
Source: Public Records
Mortgage History
| Date | Status | Borrower | Loan Amount |
|---|---|---|---|
| Open | Cowan Howard R | $154,000 | |
| Previous Owner | Nehmer David L | $97,000 | |
| Previous Owner | Nehmer David L | $73,600 | |
| Previous Owner | Nehmer David L | $97,000 |
Source: Public Records
Tax History
| Year | Tax Paid | Tax Assessment Tax Assessment Total Assessment is a certain percentage of the fair market value that is determined by local assessors to be the total taxable value of land and additions on the property. | Land | Improvement |
|---|---|---|---|---|
| 2025 | $5,337 | $340,400 | $58,000 | $282,400 |
| 2024 | $5,115 | $318,500 | $58,000 | $260,500 |
| 2023 | $4,713 | $276,400 | $55,200 | $221,200 |
| 2022 | $4,440 | $235,900 | $55,200 | $180,700 |
| 2021 | $4,268 | $225,800 | $50,100 | $175,700 |
| 2020 | $4,160 | $213,000 | $50,100 | $162,900 |
| 2019 | $4,166 | $211,700 | $50,100 | $161,600 |
| 2018 | $4,044 | $205,500 | $50,100 | $155,400 |
| 2017 | $4,115 | $209,300 | $50,100 | $159,200 |
| 2016 | $3,977 | $202,300 | $50,100 | $152,200 |
| 2015 | $3,745 | $190,400 | $50,100 | $140,300 |
Source: Public Records
Map
Nearby Homes
- 1962 Allen St
- 0 Apple Blossom Ln
- 17 Skyridge Ln
- 25 Laurelwood Ln
- 140 Slumber Ln
- 16 Deerfoot Dr
- 41 Hillside Dr
- 86 Wildwood Ave
- 24 Wands St
- 85 Talmadge Dr
- 86 Talmadge Dr
- 81 W Crystal Brook Dr
- 25 Winding Brook Ln
- 303 Kibbe Rd
- 46 Holland Dr
- 137 Mapleshade Ave
- 17 Pebble Mill Rd
- 228 Acrebrook Rd
- 120 Bridle Path Rd
- 25 Angelica Dr
Your Personal Tour Guide
Ask me questions while you tour the home.