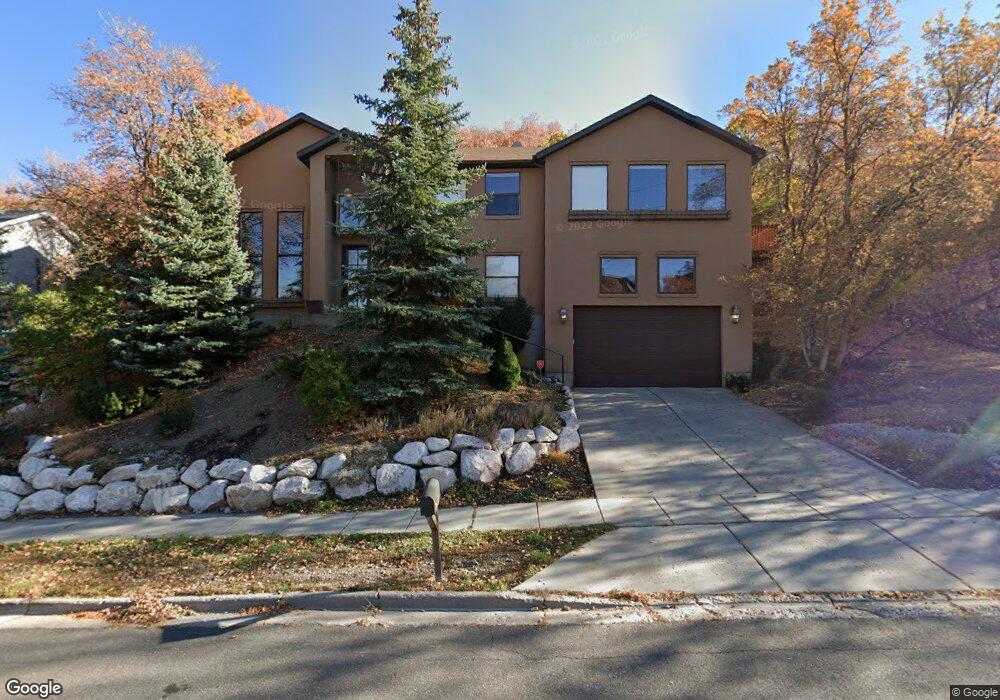
2067 Bountiful Blvd Unit 29 Bountiful, UT 84010
Estimated Value: $696,534 - $744,000
3
Beds
2
Baths
2,772
Sq Ft
$258/Sq Ft
Est. Value
About This Home
This home is located at 2067 Bountiful Blvd Unit 29, Bountiful, UT 84010 and is currently estimated at $716,384, approximately $258 per square foot. 2067 Bountiful Blvd Unit 29 is a home located in Davis County with nearby schools including Valley View School, Mueller Park Junior High School, and Bountiful High School.
Ownership History
Date
Name
Owned For
Owner Type
Purchase Details
Closed on
Jul 29, 2024
Sold by
Ferguson Sherrie L and Olds Sherrie L
Bought by
Olds Sherrie L and Olds Thomas S
Current Estimated Value
Home Financials for this Owner
Home Financials are based on the most recent Mortgage that was taken out on this home.
Original Mortgage
$200,000
Outstanding Balance
$197,556
Interest Rate
6.87%
Mortgage Type
New Conventional
Estimated Equity
$518,828
Purchase Details
Closed on
Jul 22, 2003
Sold by
Noyce Christopher
Bought by
Ferguson Sherrie L
Home Financials for this Owner
Home Financials are based on the most recent Mortgage that was taken out on this home.
Original Mortgage
$172,000
Interest Rate
5.46%
Mortgage Type
Purchase Money Mortgage
Purchase Details
Closed on
Oct 2, 2002
Sold by
Tracy Pamela
Bought by
Noyce Christopher
Home Financials for this Owner
Home Financials are based on the most recent Mortgage that was taken out on this home.
Original Mortgage
$195,000
Interest Rate
6.22%
Create a Home Valuation Report for This Property
The Home Valuation Report is an in-depth analysis detailing your home's value as well as a comparison with similar homes in the area
Purchase History
| Date | Buyer | Sale Price | Title Company |
|---|---|---|---|
| Olds Sherrie L | -- | National Title Insurance Compa | |
| Olds Sherrie L | -- | National Title Insurance Compa | |
| Ferguson Sherrie L | -- | Equity Title Agency | |
| Noyce Christopher | -- | Atlas Title Insurance |
Source: Public Records
Mortgage History
| Date | Status | Borrower | Loan Amount |
|---|---|---|---|
| Open | Olds Sherrie L | $200,000 | |
| Closed | Olds Sherrie L | $200,000 | |
| Previous Owner | Ferguson Sherrie L | $172,000 | |
| Previous Owner | Noyce Christopher | $195,000 |
Source: Public Records
Tax History
| Year | Tax Paid | Tax Assessment Tax Assessment Total Assessment is a certain percentage of the fair market value that is determined by local assessors to be the total taxable value of land and additions on the property. | Land | Improvement |
|---|---|---|---|---|
| 2025 | $3,529 | $332,750 | $56,195 | $276,555 |
| 2024 | $3,295 | $305,250 | $70,095 | $235,155 |
| 2023 | $3,133 | $548,000 | $103,533 | $444,467 |
| 2022 | $3,265 | $313,500 | $55,646 | $257,854 |
| 2021 | $3,025 | $443,000 | $82,131 | $360,869 |
| 2020 | $2,724 | $391,000 | $76,124 | $314,876 |
| 2019 | $2,613 | $384,000 | $77,980 | $306,020 |
| 2018 | $2,357 | $354,000 | $78,330 | $275,670 |
| 2016 | $2,235 | $182,050 | $23,949 | $158,101 |
| 2015 | $2,382 | $183,480 | $23,949 | $159,531 |
| 2014 | $2,656 | $209,329 | $23,949 | $185,380 |
| 2013 | -- | $176,323 | $32,948 | $143,375 |
Source: Public Records
Map
Nearby Homes
- 1820 S High Pointe Dr
- 1475 Mueller Park Rd
- 1785 1450 E Unit 604
- 1735 S Temple Ct Unit 203
- 1596 E Millbrook Way
- 0 Bountiful Blvd
- 1878 E Ridge Point Dr
- 2136 Elaine Dr
- 1087 Arlington Way
- 1676 E Mueller Park Rd
- 1014 Beverly Way
- 2091 Windsor Park Cir
- 842 E 2150 S
- 1997 S 800 E
- 771 E 1825 S
- 626 E 2150 S
- 795 Abby Ln Unit 5
- 631 E 1700 S
- 0 Lot Bountiful Blvd
- 3252 Sunset Hollow Dr
- 2067 Bountiful Blvd
- 2049 Bountiful Blvd
- 2033 Bountiful Blvd
- 2093 Bountiful Blvd
- 2107 Ridgewood Way
- 2107 Ridgewood Way Unit 21
- 2115 Ridgewood Way
- 2107 Ridgewood Way
- 2119 Ridgewood Way
- 2111 Ridgewood Way
- 2111 Ridgewood Way
- 2123 Ridgewood Way
- 2103 Ridgewood Way
- 2127 Ridgewood Way
- 2131 Ridgewood Way
- 2119 Bountiful Blvd
- 2119 Bountiful Blvd
- 1540 Cave Hollow Way
- 2041 Mapleview Dr Unit 129
- 2037 Mapleview Dr
Your Personal Tour Guide
Ask me questions while you tour the home.