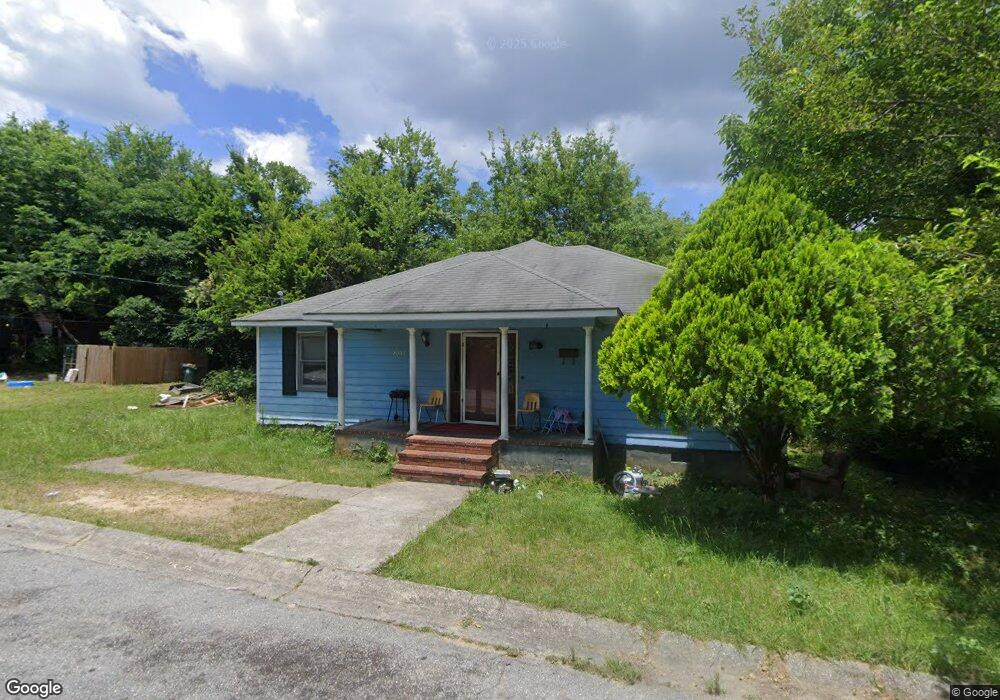
2067 Roosevelt Ave Macon, GA 31204
Pleasant Hill Historic District NeighborhoodEstimated Value: $104,000 - $139,000
3
Beds
2
Baths
1,324
Sq Ft
$93/Sq Ft
Est. Value
About This Home
This home is located at 2067 Roosevelt Ave, Macon, GA 31204 and is currently estimated at $123,160, approximately $93 per square foot. 2067 Roosevelt Ave is a home located in Bibb County with nearby schools including Williams Elementary School, Miller Fine Arts Magnet Middle School, and Central High School.
Ownership History
Date
Name
Owned For
Owner Type
Purchase Details
Closed on
Feb 11, 2005
Sold by
Deleon Nicholle
Bought by
Sellers Myron D and Sellers Penny L
Current Estimated Value
Purchase Details
Closed on
Aug 3, 2004
Create a Home Valuation Report for This Property
The Home Valuation Report is an in-depth analysis detailing your home's value as well as a comparison with similar homes in the area
Home Values in the Area
Average Home Value in this Area
Purchase History
| Date | Buyer | Sale Price | Title Company |
|---|---|---|---|
| Sellers Myron D | -- | None Available | |
| Leon Nicholle N M De | $30,000 | None Available | |
| -- | $20,900 | -- |
Source: Public Records
Tax History Compared to Growth
Tax History
| Year | Tax Paid | Tax Assessment Tax Assessment Total Assessment is a certain percentage of the fair market value that is determined by local assessors to be the total taxable value of land and additions on the property. | Land | Improvement |
|---|---|---|---|---|
| 2025 | $986 | $40,143 | $2,844 | $37,299 |
| 2024 | $986 | $38,833 | $2,280 | $36,553 |
| 2023 | $948 | $37,334 | $1,900 | $35,434 |
| 2022 | $937 | $27,065 | $1,491 | $25,574 |
| 2021 | $1,028 | $27,065 | $1,491 | $25,574 |
| 2020 | $1,051 | $27,065 | $1,491 | $25,574 |
| 2019 | $893 | $22,815 | $1,754 | $21,061 |
| 2018 | $1,548 | $22,815 | $1,754 | $21,061 |
| 2017 | $855 | $22,815 | $1,754 | $21,061 |
| 2016 | $789 | $22,816 | $1,754 | $21,061 |
| 2015 | $1,185 | $24,198 | $1,754 | $22,443 |
| 2014 | $1,363 | $24,198 | $1,754 | $22,443 |
Source: Public Records
Map
Nearby Homes
- 313 Forest Ave
- 320 Lincoln Ave
- 319 Ruby St
- 335 Lincoln Ave
- 254 Forest Ave
- 2089 Walnut St
- 2033 Third Ave
- 305 Grant Ave
- 2005 Third Ave
- 260 Brief St
- 382 Forest Ave
- 2072 Third Ave
- 367 Lincoln Ave
- 2129 Roosevelt Ave
- 195 Forest Ave
- 290 Moughon St
- 2125 Neal Ave
- 1905 3rd Ave
- 2186 Neal Ave
- 2208 Roosevelt Ave