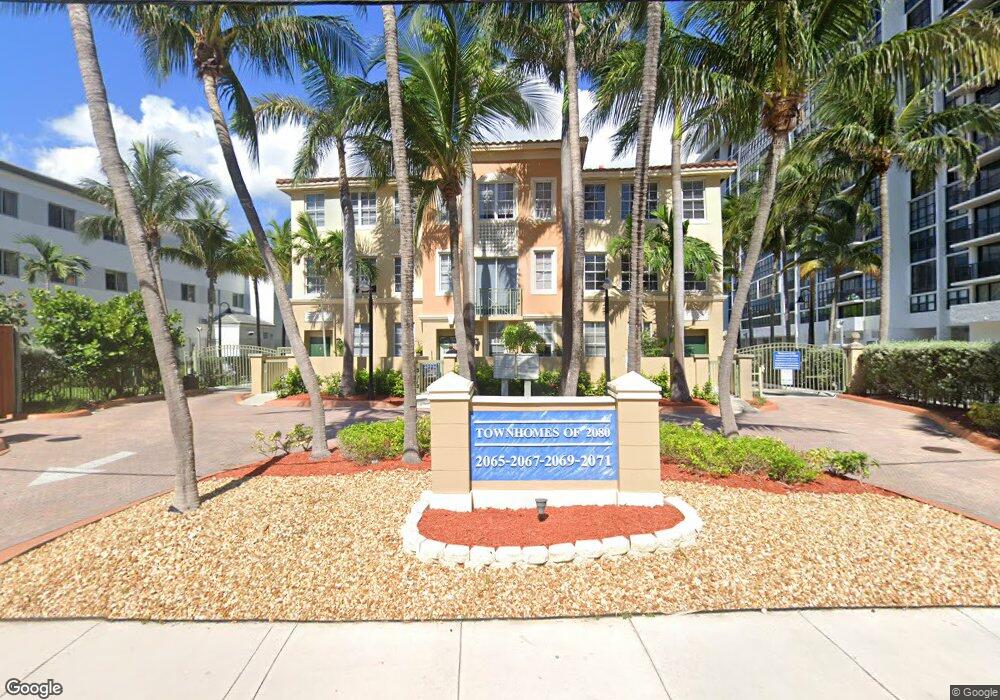
2067 S Ocean Dr Unit TH7 Hallandale Beach, FL 33009
Oceanside NeighborhoodEstimated Value: $610,000 - $924,000
3
Beds
3
Baths
1,700
Sq Ft
$458/Sq Ft
Est. Value
About This Home
This home is located at 2067 S Ocean Dr Unit TH7, Hallandale Beach, FL 33009 and is currently estimated at $778,221, approximately $457 per square foot. 2067 S Ocean Dr Unit TH7 is a home located in Broward County with nearby schools including Gulfstream Academy of Hallandale Beach, Hallandale High School, and South Broward Montessori Charter School.
Ownership History
Date
Name
Owned For
Owner Type
Purchase Details
Closed on
May 6, 2013
Sold by
Lafleur Luc J and Lafleur Lynn A
Bought by
Lubell Myron S and Lubell Yolanda H
Current Estimated Value
Purchase Details
Closed on
May 31, 2006
Sold by
Miller Jerry
Bought by
Lafleur Luc J and Lafleur Lynn A
Purchase Details
Closed on
Aug 31, 2005
Sold by
Sacramento Inc
Bought by
Miller Jerry
Home Financials for this Owner
Home Financials are based on the most recent Mortgage that was taken out on this home.
Original Mortgage
$392,000
Interest Rate
8.67%
Mortgage Type
Fannie Mae Freddie Mac
Purchase Details
Closed on
Jun 25, 2003
Sold by
Riviera Yacht & Beach Club Ltd
Bought by
Sacramento Inc
Home Financials for this Owner
Home Financials are based on the most recent Mortgage that was taken out on this home.
Original Mortgage
$249,800
Interest Rate
4.62%
Mortgage Type
Unknown
Create a Home Valuation Report for This Property
The Home Valuation Report is an in-depth analysis detailing your home's value as well as a comparison with similar homes in the area
Home Values in the Area
Average Home Value in this Area
Purchase History
| Date | Buyer | Sale Price | Title Company |
|---|---|---|---|
| Lubell Myron S | $350,000 | All Country Title Agency Inc | |
| Lafleur Luc J | $600,000 | None Available | |
| Miller Jerry | $490,000 | -- | |
| Sacramento Inc | $333,200 | -- |
Source: Public Records
Mortgage History
| Date | Status | Borrower | Loan Amount |
|---|---|---|---|
| Previous Owner | Miller Jerry | $392,000 | |
| Previous Owner | Sacramento Inc | $249,800 |
Source: Public Records
Tax History Compared to Growth
Tax History
| Year | Tax Paid | Tax Assessment Tax Assessment Total Assessment is a certain percentage of the fair market value that is determined by local assessors to be the total taxable value of land and additions on the property. | Land | Improvement |
|---|---|---|---|---|
| 2025 | $7,376 | $389,510 | -- | -- |
| 2024 | $7,337 | $378,540 | -- | -- |
| 2023 | $7,337 | $367,520 | $0 | $0 |
| 2022 | $6,973 | $356,820 | $0 | $0 |
| 2021 | $6,516 | $346,430 | $34,640 | $311,790 |
| 2020 | $6,859 | $361,690 | $36,170 | $325,520 |
| 2019 | $6,826 | $358,090 | $0 | $0 |
| 2018 | $6,368 | $351,420 | $35,140 | $316,280 |
| 2017 | $6,119 | $353,200 | $0 | $0 |
| 2016 | $6,108 | $345,940 | $0 | $0 |
| 2015 | $6,027 | $343,540 | $0 | $0 |
| 2014 | $6,734 | $338,860 | $0 | $0 |
| 2013 | -- | $293,740 | $29,370 | $264,370 |
Source: Public Records
Map
Nearby Homes
- 2030 S Ocean Dr Unit 2127
- 2030 S Ocean Dr Unit 1710
- 2030 S Ocean Dr Unit 1218
- 2030 S Ocean Dr Unit 2027
- 2030 S Ocean Dr Unit 2201
- 2030 S Ocean Dr Unit 1407
- 2030 S Ocean Dr Unit 516
- 2030 S Ocean Dr Unit 727
- 2030 S Ocean Dr Unit 502
- 2030 S Ocean Dr Unit 216
- 2030 S Ocean Dr Unit 2018
- 2030 S Ocean Dr Unit 2126
- 2030 S Ocean Dr Unit 227
- 2030 S Ocean Dr Unit 626
- 2030 S Ocean Dr Unit 1707
- 2030 S Ocean Dr Unit 1708
- 2030 S Ocean Dr Unit 2223
- 2030 S Ocean Dr Unit 1804
- 2030 S Ocean Dr Unit 1704
- 2030 S Ocean Dr Unit 2009
- 2069 S Ocean Dr Unit TH
- 2065 S Ocean Dr Unit FL9-ID1049793P
- 2069 S Ocean Dr
- 2080 2080 S Ocean Dr # 1510 Unit 1510
- 2080 2080 S Ocean Dr # 1712 Unit 1712
- 2080 2080 S Ocean Drive # 1108 Unit 1108
- 2080 2080 S Ocean Dr # 1602 Unit 1602
- 2080 2080 S Ocean Dr # 802 Unit 802
- 2071 S Ocean Dr Unit TH21
- 2069 S Ocean Dr Unit TH13
- 2069 S Ocean Dr Unit TH14
- 2067 S Ocean Dr Unit TH6
- 2067 S Ocean Dr Unit TH5
- 2069 S Ocean Dr Unit TH17
- 2069 S Ocean Dr Unit TH7
- 2069 S Ocean Dr Unit TH12
- 2069 S Ocean Dr Unit TH10
- 2065 S Ocean Dr Unit TH3
- 2071 S Ocean Dr Unit TH20
- 2071 S Ocean Dr Unit TH19