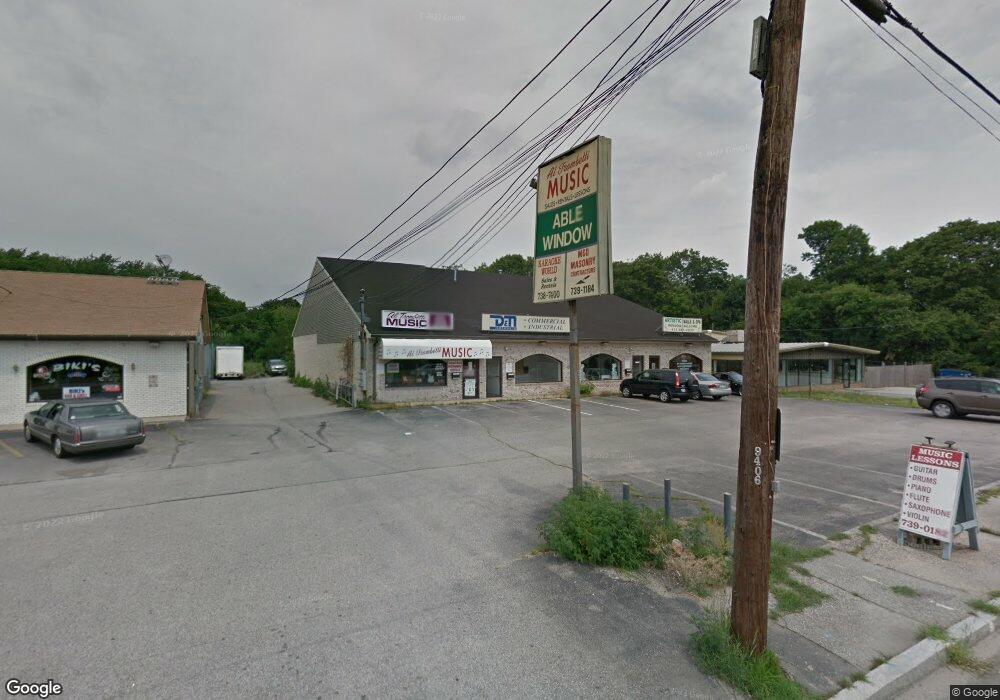
2067 W Shore Rd Unit 7 Warwick, RI 02889
Oakland Beach Neighborhood
--
Bed
--
Bath
912
Sq Ft
--
Built
About This Home
This home is located at 2067 W Shore Rd Unit 7, Warwick, RI 02889. 2067 W Shore Rd Unit 7 is a home located in Kent County with nearby schools including Saint Kevin School.
Ownership History
Date
Name
Owned For
Owner Type
Purchase Details
Closed on
Jun 30, 2021
Sold by
Trombetti Dolores A Est and Gorman
Bought by
Papas Nickolas
Purchase Details
Closed on
Jan 8, 2013
Sold by
Zip Lock Realty
Bought by
Papas Nickolas
Purchase Details
Closed on
Oct 31, 2012
Sold by
Hayon Realty
Bought by
Cunha Michael F
Purchase Details
Closed on
Jan 11, 2012
Sold by
2Nd Street Partners
Bought by
Hayon Realty
Purchase Details
Closed on
Dec 22, 2011
Sold by
Warwick City Of and Bachetti
Bought by
Gardner Michael J
Purchase Details
Closed on
Jun 7, 2011
Sold by
Cunha Michael F
Bought by
Zip Lock Realty
Purchase Details
Closed on
Apr 20, 1989
Sold by
Jefferson Assoc
Bought by
Boucher Raymond
Home Financials for this Owner
Home Financials are based on the most recent Mortgage that was taken out on this home.
Original Mortgage
$64,000
Interest Rate
10.79%
Mortgage Type
Commercial
Purchase Details
Closed on
Aug 26, 1988
Sold by
Jefferson Assoc
Bought by
Silvis Ernest
Create a Home Valuation Report for This Property
The Home Valuation Report is an in-depth analysis detailing your home's value as well as a comparison with similar homes in the area
Home Values in the Area
Average Home Value in this Area
Purchase History
| Date | Buyer | Sale Price | Title Company |
|---|---|---|---|
| Papas Nickolas | $49,500 | None Available | |
| Papas Nickolas | $49,500 | None Available | |
| Papas Nickolas | $45,000 | -- | |
| Papas Nickolas | $40,000 | -- | |
| Papas Nickolas | $40,000 | -- | |
| Cunha Michael F | -- | -- | |
| Hayon Realty | -- | -- | |
| Cunha Michael F | -- | -- | |
| Hayon Realty | -- | -- | |
| Hayon Realty | -- | -- | |
| Gardner Michael J | $7,377 | -- | |
| Gardner Michael J | $7,377 | -- | |
| Zip Lock Realty | -- | -- | |
| Zip Lock Realty | -- | -- | |
| Zip Lock Realty | -- | -- | |
| Boucher Raymond | $80,000 | -- | |
| Boucher Raymond | $80,000 | -- | |
| Silvis Ernest | $10,000 | -- | |
| Silvis Ernest | $10,000 | -- |
Source: Public Records
Mortgage History
| Date | Status | Borrower | Loan Amount |
|---|---|---|---|
| Previous Owner | Silvis Ernest | $64,000 |
Source: Public Records
Tax History Compared to Growth
Tax History
| Year | Tax Paid | Tax Assessment Tax Assessment Total Assessment is a certain percentage of the fair market value that is determined by local assessors to be the total taxable value of land and additions on the property. | Land | Improvement |
|---|---|---|---|---|
| 2025 | $2,982 | $124,300 | $0 | $124,300 |
| 2024 | $2,955 | $116,700 | $0 | $116,700 |
| 2023 | $2,898 | $116,700 | $0 | $116,700 |
| 2022 | $3,361 | $119,600 | $0 | $119,600 |
| 2021 | $3,361 | $119,600 | $0 | $119,600 |
| 2020 | $3,361 | $119,600 | $0 | $119,600 |
| 2019 | $3,361 | $119,600 | $0 | $119,600 |
| 2018 | $3,883 | $124,500 | $0 | $124,500 |
| 2017 | $3,780 | $124,500 | $0 | $124,500 |
| 2016 | $3,780 | $124,500 | $0 | $124,500 |
| 2015 | $3,885 | $124,800 | $0 | $124,800 |
| 2014 | $3,755 | $124,800 | $0 | $124,800 |
| 2013 | $3,704 | $124,800 | $0 | $124,800 |
Source: Public Records
Map
Nearby Homes
- 9 Chelmsford Ave
- 34 Pequot Ave
- 117 Second Point Rd
- 136 Sefton Ave
- 31 Oakhurst Ave
- 86 Glen Dr
- 1851 W Shore Rd
- 71 Northup St
- 75 Northup St
- 80 Northup St
- 176 Canfield Ave
- 235 Pequot Ave
- 191 Canfield Ave
- 209 Wood St
- 141 Brush Neck Ave
- 107 Coburn St
- 19 Curtis St
- 76 Kenway Ave
- 700 Sandy Ln Unit 6
- 700 Sandy Ln Unit 17
- 2067 W Shore Rd
- 2067 W Shore Rd Unit 5
- 2067 W Shore Rd Unit 1+2
- 2077 W Shore Rd
- 2078 W Shore Rd
- 2046 W Shore Rd
- 250 Oakland Beach Ave
- 2031 W Shore Rd
- 2040 W Shore Rd
- 11 Judith Ave
- 12 Judith Ave
- 17 Judith Ave
- 2032 W Shore Rd
- 18 Judith Ave
- 47 Wild Flower Cir
- 24 Judith Ave
- 41 Wild Flower Cir
- 51 Wild Flower Cir
- 315 Oakland Beach Ave
- 33 Wild Flower Cir