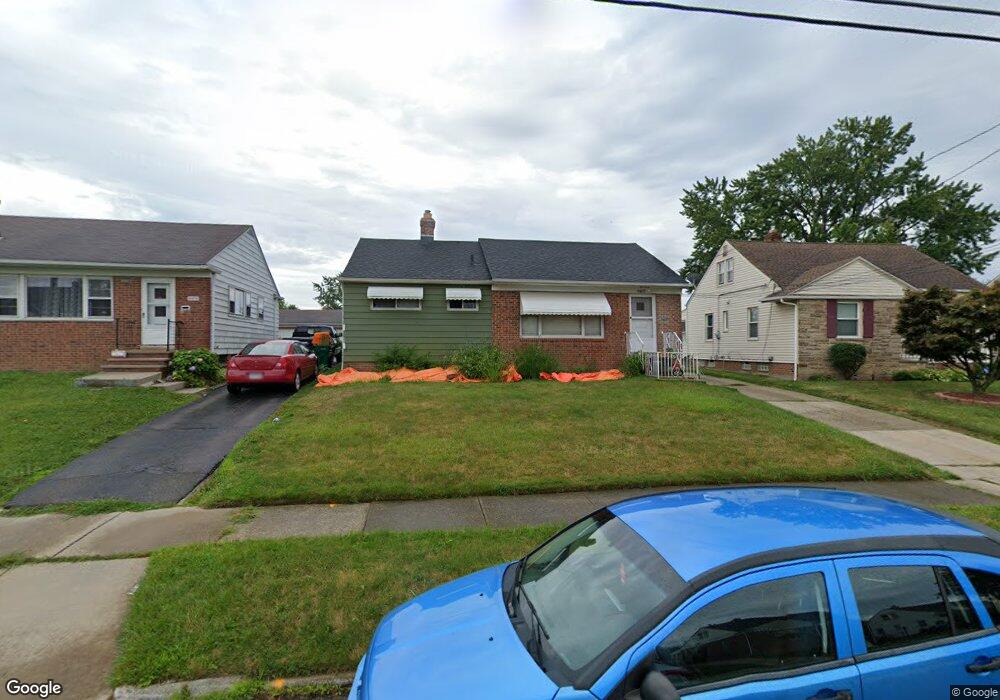
20672 Applegate Rd Maple Heights, OH 44137
Estimated Value: $111,000 - $127,000
3
Beds
1
Bath
1,008
Sq Ft
$117/Sq Ft
Est. Value
About This Home
This home is located at 20672 Applegate Rd, Maple Heights, OH 44137 and is currently estimated at $118,276, approximately $117 per square foot. 20672 Applegate Rd is a home located in Cuyahoga County with nearby schools including Abraham Lincoln Elementary School, Rockside/ J.F. Kennedy School, and Barack Obama School.
Ownership History
Date
Name
Owned For
Owner Type
Purchase Details
Closed on
Dec 17, 2007
Sold by
Deutsche Bank National Trust Co
Bought by
Rozier Sherelle
Current Estimated Value
Home Financials for this Owner
Home Financials are based on the most recent Mortgage that was taken out on this home.
Original Mortgage
$74,500
Interest Rate
6.11%
Mortgage Type
Purchase Money Mortgage
Purchase Details
Closed on
Apr 2, 2007
Sold by
Anderson Charlotte and Anderson Charlie
Bought by
Deutsche Bank National Trust Co
Purchase Details
Closed on
Jun 20, 2003
Sold by
Burchett Joann
Bought by
Anderson Charlotte
Home Financials for this Owner
Home Financials are based on the most recent Mortgage that was taken out on this home.
Original Mortgage
$79,050
Interest Rate
7.2%
Mortgage Type
Purchase Money Mortgage
Purchase Details
Closed on
Oct 23, 2002
Sold by
Estate Of Flem W Burchett
Bought by
Burchett Joann
Purchase Details
Closed on
Jan 1, 1975
Bought by
Burchett Flem and Burchett Joann
Create a Home Valuation Report for This Property
The Home Valuation Report is an in-depth analysis detailing your home's value as well as a comparison with similar homes in the area
Home Values in the Area
Average Home Value in this Area
Purchase History
| Date | Buyer | Sale Price | Title Company |
|---|---|---|---|
| Rozier Sherelle | $74,500 | Prism Title & Closing | |
| Deutsche Bank National Trust Co | $63,334 | Attorney | |
| Anderson Charlotte | $93,000 | Midland Title Security Inc | |
| Burchett Joann | -- | -- | |
| Burchett Flem | -- | -- |
Source: Public Records
Mortgage History
| Date | Status | Borrower | Loan Amount |
|---|---|---|---|
| Previous Owner | Rozier Sherelle | $74,500 | |
| Previous Owner | Anderson Charlotte | $79,050 |
Source: Public Records
Tax History
| Year | Tax Paid | Tax Assessment Tax Assessment Total Assessment is a certain percentage of the fair market value that is determined by local assessors to be the total taxable value of land and additions on the property. | Land | Improvement |
|---|---|---|---|---|
| 2024 | $3,676 | $39,970 | $7,560 | $32,410 |
| 2023 | $2,681 | $24,650 | $5,010 | $19,640 |
| 2022 | $2,672 | $24,640 | $5,010 | $19,640 |
| 2021 | $2,851 | $24,640 | $5,010 | $19,640 |
| 2020 | $2,431 | $18,660 | $3,780 | $14,880 |
| 2019 | $2,418 | $53,300 | $10,800 | $42,500 |
| 2018 | $2,845 | $18,660 | $3,780 | $14,880 |
| 2017 | $2,406 | $18,240 | $3,750 | $14,490 |
| 2016 | $2,326 | $18,240 | $3,750 | $14,490 |
| 2015 | $2,333 | $18,240 | $3,750 | $14,490 |
| 2014 | $2,333 | $20,020 | $4,130 | $15,890 |
Source: Public Records
Map
Nearby Homes
- 339 Grand Blvd
- 19113 Watercrest Ave
- 123 Willard Ave
- 21202 Gardenview Dr
- 54 Willard Ave
- 419 Center Rd
- 66 Hubbell Way
- 58 Hubbell Way
- 62 Hubbell Way
- 54 Hubbell Way
- 0 Hubbell Cir
- 21607 Libby Rd
- 61 Hubbell Way
- 57 Hubbell Way
- 20806 Clare Ave
- 19289 Stafford Ave
- 21202 Hillgrove Ave
- 5424 Fairtree Rd
- 5147 Warrensville Center Rd
- 21207 Franklin Rd
- 20668 Applegate Rd
- 20676 Applegate Rd
- 20664 Applegate Rd
- 20680 Applegate Rd
- 20671 Donny Brook Rd
- 20675 Donny Brook Rd
- 20667 Donny Brook Rd
- 20684 Applegate Rd
- 20679 Donny Brook Rd
- 20660 Applegate Rd
- 20663 Donny Brook Rd
- 20671 Applegate Rd
- 20667 Applegate Rd
- 20675 Applegate Rd
- 20683 Donny Brook Rd
- 20663 Applegate Rd
- 20688 Applegate Rd
- 20659 Donny Brook Rd
- 20679 Applegate Rd
- 20656 Applegate Rd
Your Personal Tour Guide
Ask me questions while you tour the home.