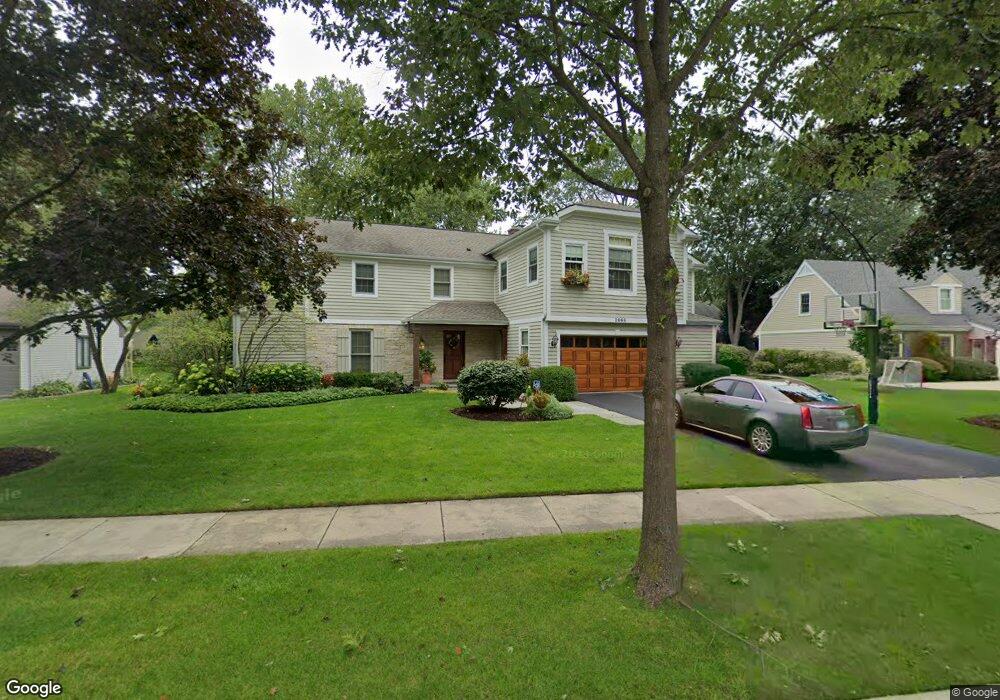
2068 Butternut Ln Northbrook, IL 60062
Estimated Value: $896,000 - $1,408,000
5
Beds
3
Baths
3,634
Sq Ft
$319/Sq Ft
Est. Value
About This Home
This home is located at 2068 Butternut Ln, Northbrook, IL 60062 and is currently estimated at $1,159,834, approximately $319 per square foot. 2068 Butternut Ln is a home located in Cook County with nearby schools including Wescott Elementary School, Maple School, and Glenbrook North High School.
Ownership History
Date
Name
Owned For
Owner Type
Purchase Details
Closed on
May 20, 2025
Sold by
Gruemmer Brooks B and Gruemmer Kimberly K
Bought by
Gruemmer Brooks B and Gruemmer Kimberly K
Current Estimated Value
Purchase Details
Closed on
May 17, 1997
Sold by
Gladson Michael D and Gladson Lisa R
Bought by
Gruemmer Brooks B and Gruemmer Kimberly K
Home Financials for this Owner
Home Financials are based on the most recent Mortgage that was taken out on this home.
Original Mortgage
$336,000
Interest Rate
7.87%
Purchase Details
Closed on
Jul 14, 1995
Sold by
Siegele Frederick H
Bought by
Gladson Michael D and Gladson Lisa R
Home Financials for this Owner
Home Financials are based on the most recent Mortgage that was taken out on this home.
Original Mortgage
$200,000
Interest Rate
7.5%
Create a Home Valuation Report for This Property
The Home Valuation Report is an in-depth analysis detailing your home's value as well as a comparison with similar homes in the area
Home Values in the Area
Average Home Value in this Area
Purchase History
| Date | Buyer | Sale Price | Title Company |
|---|---|---|---|
| Gruemmer Brooks B | -- | None Listed On Document | |
| Gruemmer Brooks B | $420,000 | -- | |
| Gladson Michael D | -- | -- |
Source: Public Records
Mortgage History
| Date | Status | Borrower | Loan Amount |
|---|---|---|---|
| Previous Owner | Gruemmer Brooks B | $336,000 | |
| Previous Owner | Gladson Michael D | $200,000 |
Source: Public Records
Tax History Compared to Growth
Tax History
| Year | Tax Paid | Tax Assessment Tax Assessment Total Assessment is a certain percentage of the fair market value that is determined by local assessors to be the total taxable value of land and additions on the property. | Land | Improvement |
|---|---|---|---|---|
| 2024 | $18,269 | $80,611 | $18,288 | $62,323 |
| 2023 | $19,110 | $80,611 | $18,288 | $62,323 |
| 2022 | $19,110 | $86,535 | $18,288 | $68,247 |
| 2021 | $15,252 | $62,060 | $14,630 | $47,430 |
| 2020 | $15,160 | $62,060 | $14,630 | $47,430 |
| 2019 | $14,588 | $68,198 | $14,630 | $53,568 |
| 2018 | $13,586 | $59,098 | $12,801 | $46,297 |
| 2017 | $13,321 | $59,098 | $12,801 | $46,297 |
| 2016 | $12,173 | $59,098 | $12,801 | $46,297 |
| 2015 | $12,761 | $55,917 | $10,363 | $45,554 |
| 2014 | $12,456 | $55,917 | $10,363 | $45,554 |
| 2013 | $12,282 | $55,917 | $10,363 | $45,554 |
Source: Public Records
Map
Nearby Homes
- 2067 Butternut Ln
- 2130 Mallard Dr
- 1947 Summerton Place
- 2378 Salceda Dr Unit 25B2378S
- 2425 El Cid Ln
- 1997 Kingsley Cir
- 2050 Valencia Dr Unit 405C
- 2545 Salceda Dr Unit 5B2545S
- 2411 Woodlawn Rd
- 3065 Lexington Ln Unit 17L41
- 2526 Essex Dr
- 2571 Essex Dr
- 2221 Illinois Rd
- 1950 Farnsworth Ln Unit 202
- 2117 Illinois Rd
- 187 Princeton Ln Unit 35RG18
- 2409 Center Ave
- 1721 Elm Ave
- 1445 Pfingsten Rd
- 1435 Pfingsten Rd
- 2104 Butternut Ln
- 2058 Butternut Ln
- 2071 Glendale Ave
- 2107 Glendale Ave
- 2061 Glendale Ave
- 2114 Butternut Ln
- 2048 Butternut Ln
- 2057 Butternut Ln
- 2051 Glendale Ave
- 2105 Butternut Ln
- 2117 Glendale Ave
- 2047 Butternut Ln
- 2124 Butternut Ln
- 2115 Butternut Ln
- 2038 Butternut Ln
- 2127 Glendale Ave
- 2041 Glendale Ave
- 2070 Glendale Ave
- 2106 Glendale Ave
- 2037 Butternut Ln