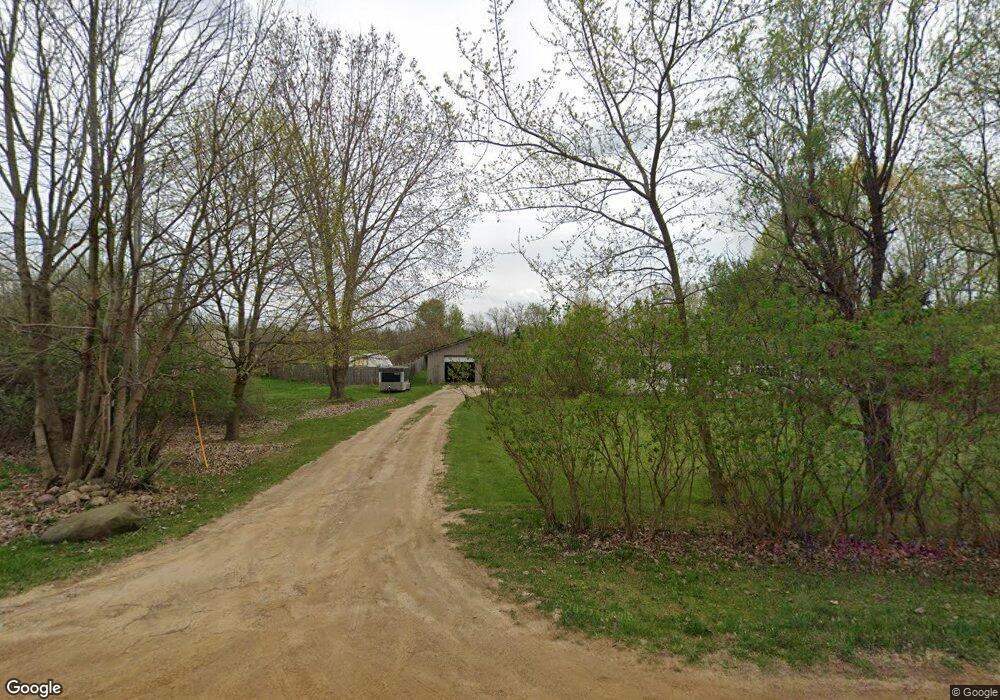
2068 Houser Rd Holly, MI 48442
Rose Township NeighborhoodEstimated Value: $180,576 - $354,000
3
Beds
3
Baths
1,854
Sq Ft
$149/Sq Ft
Est. Value
About This Home
This home is located at 2068 Houser Rd, Holly, MI 48442 and is currently estimated at $277,144, approximately $149 per square foot. 2068 Houser Rd is a home located in Oakland County with nearby schools including Fenton Senior High School, Holly Academy, and Adelphian Junior Academy.
Ownership History
Date
Name
Owned For
Owner Type
Purchase Details
Closed on
May 16, 2014
Sold by
Horan Linda and Horan Kenneth W
Bought by
Horan Linda
Current Estimated Value
Purchase Details
Closed on
May 21, 2010
Sold by
Concord Homes Llc
Bought by
Horan Kenneth and Horan Linda
Home Financials for this Owner
Home Financials are based on the most recent Mortgage that was taken out on this home.
Original Mortgage
$75,550
Interest Rate
4.28%
Mortgage Type
New Conventional
Purchase Details
Closed on
Jul 5, 2006
Sold by
Green Tree Servicing Llc
Bought by
Concord Homes Llc
Purchase Details
Closed on
Mar 21, 2006
Sold by
Buchanan Ronald R
Bought by
Green Tree Servicing Llc and Greenpoint Credit Llc
Purchase Details
Closed on
Jun 24, 1999
Sold by
Clymer Michael James
Bought by
Buchanan Ronald
Purchase Details
Closed on
Mar 11, 1998
Sold by
Simmons John F
Bought by
Clymer Michael James
Purchase Details
Closed on
Aug 28, 1997
Sold by
Clymer Michael James
Bought by
Simmons John F
Create a Home Valuation Report for This Property
The Home Valuation Report is an in-depth analysis detailing your home's value as well as a comparison with similar homes in the area
Home Values in the Area
Average Home Value in this Area
Purchase History
| Date | Buyer | Sale Price | Title Company |
|---|---|---|---|
| Horan Linda | -- | Capital Title Ins Agency | |
| Horan Kenneth | $90,000 | Capital Title Ins Agency | |
| Concord Homes Llc | $99,500 | Philip R Seaver Title Co Inc | |
| Green Tree Servicing Llc | $132,586 | None Available | |
| Buchanan Ronald | $29,900 | -- | |
| Clymer Michael James | -- | -- | |
| Simmons John F | -- | -- |
Source: Public Records
Mortgage History
| Date | Status | Borrower | Loan Amount |
|---|---|---|---|
| Previous Owner | Horan Kenneth | $75,550 |
Source: Public Records
Tax History Compared to Growth
Tax History
| Year | Tax Paid | Tax Assessment Tax Assessment Total Assessment is a certain percentage of the fair market value that is determined by local assessors to be the total taxable value of land and additions on the property. | Land | Improvement |
|---|---|---|---|---|
| 2024 | $776 | $136,630 | $0 | $0 |
| 2023 | $740 | $129,370 | $0 | $0 |
| 2022 | $2,018 | $118,460 | $0 | $0 |
| 2021 | $1,799 | $110,580 | $0 | $0 |
| 2020 | $676 | $103,800 | $0 | $0 |
| 2019 | $1,777 | $99,360 | $0 | $0 |
| 2018 | $1,745 | $92,160 | $0 | $0 |
| 2017 | $1,721 | $92,160 | $0 | $0 |
| 2016 | $1,708 | $87,130 | $0 | $0 |
| 2015 | -- | $73,140 | $0 | $0 |
| 2014 | -- | $68,480 | $0 | $0 |
| 2011 | -- | $53,890 | $0 | $0 |
Source: Public Records
Map
Nearby Homes
- 123 N Jerzine Rd N
- 16255 Catalpa Way
- 16085 Catalpa Way
- 17360 Timber Creek
- 1051 Swan Ln
- 329 Beaver Run
- 337 Beaver Run
- 939 Eagle Dr Unit 124
- 961 Loon Ct Unit 49
- 419 Otter Run Rd
- 928 Eagle Dr Unit A119
- 928 Eagle Dr Unit A116
- 928 Eagle Dr Unit A117
- 928 Eagle Dr Unit A115
- 928 Eagle Dr Unit A118
- 928 Eagle Dr Unit A114
- 928 Eagle Dr Unit A113
- 928 Eagle Dr Unit A112
- 928 Eagle Dr Unit A110
- 928 Eagle Dr Unit A109
- 2078 Houser Rd
- 17003 Hickory Ridge Rd
- 17007 Hickory Ridge Rd
- 0 Hickory Ridge Rd Unit 5382478
- 0 Hickory Ridge Rd Unit 5020556
- 0 Hickory Ridge Rd Unit 5585397
- 0 Hickory Ridge Rd Unit 217036504
- 0 Hickory Ridge Rd Unit R215050510
- 0 Hickory Ridge Rd Unit R216004347
- 0 Hickory Ridge Rd Unit R215080847
- 17085 Hickory Ridge Rd
- 2130 Houser Rd
- 17010 Hickory Ridge Rd
- 2045 Houser Rd
- 17020 Hickory Ridge Rd
- 2171 Houser Rd
- 17135 Hickory Ridge Rd
- 2049 Houser Rd
- 123 Jerzine Dr
- 2202 Houser Rd