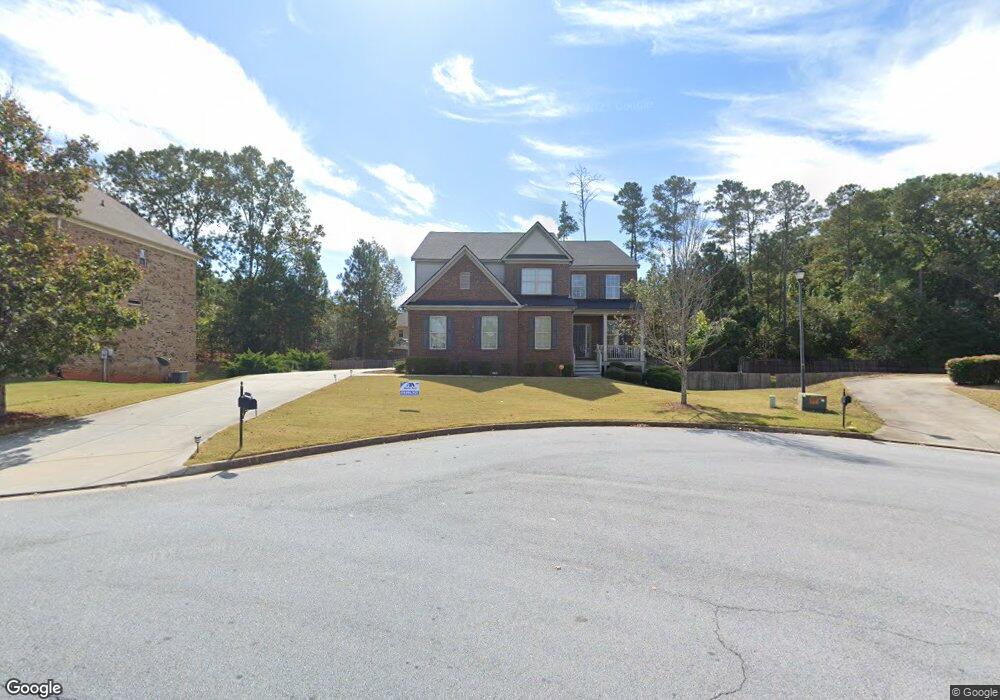
2068 Reflection Creek Dr Unit 27 Conyers, GA 30013
Estimated Value: $460,455 - $527,000
4
Beds
5
Baths
2,189
Sq Ft
$229/Sq Ft
Est. Value
About This Home
This home is located at 2068 Reflection Creek Dr Unit 27, Conyers, GA 30013 and is currently estimated at $500,364, approximately $228 per square foot. 2068 Reflection Creek Dr Unit 27 is a home located in Rockdale County with nearby schools including Honey Creek Elementary School, Memorial Middle School, and Salem High School.
Ownership History
Date
Name
Owned For
Owner Type
Purchase Details
Closed on
Jul 19, 2019
Sold by
Hay Christopher
Bought by
Crosby Maurice S
Current Estimated Value
Home Financials for this Owner
Home Financials are based on the most recent Mortgage that was taken out on this home.
Original Mortgage
$293,000
Outstanding Balance
$256,588
Interest Rate
3.8%
Estimated Equity
$243,776
Purchase Details
Closed on
Oct 7, 2016
Sold by
Pope Bryan C
Bought by
Hay Christopher and Spencer Sharon
Home Financials for this Owner
Home Financials are based on the most recent Mortgage that was taken out on this home.
Original Mortgage
$198,120
Interest Rate
3.44%
Purchase Details
Closed on
Nov 20, 2012
Sold by
D R Horton Inc
Bought by
Pope Bryan C
Home Financials for this Owner
Home Financials are based on the most recent Mortgage that was taken out on this home.
Original Mortgage
$257,285
Interest Rate
3.5%
Mortgage Type
FHA
Create a Home Valuation Report for This Property
The Home Valuation Report is an in-depth analysis detailing your home's value as well as a comparison with similar homes in the area
Home Values in the Area
Average Home Value in this Area
Purchase History
| Date | Buyer | Sale Price | Title Company |
|---|---|---|---|
| Crosby Maurice S | $293,000 | -- | |
| Hay Christopher | $254,000 | -- | |
| Pope Bryan C | $262,032 | -- |
Source: Public Records
Mortgage History
| Date | Status | Borrower | Loan Amount |
|---|---|---|---|
| Open | Crosby Maurice S | $293,000 | |
| Previous Owner | Hay Christopher | $198,120 | |
| Previous Owner | Pope Bryan C | $257,285 |
Source: Public Records
Tax History Compared to Growth
Tax History
| Year | Tax Paid | Tax Assessment Tax Assessment Total Assessment is a certain percentage of the fair market value that is determined by local assessors to be the total taxable value of land and additions on the property. | Land | Improvement |
|---|---|---|---|---|
| 2024 | $5,239 | $206,440 | $32,520 | $173,920 |
| 2023 | $5,350 | $217,520 | $36,080 | $181,440 |
| 2022 | $4,666 | $190,880 | $31,880 | $159,000 |
| 2021 | $3,728 | $144,440 | $23,800 | $120,640 |
| 2020 | $5,032 | $117,200 | $19,708 | $97,492 |
| 2019 | $2,934 | $109,200 | $13,360 | $95,840 |
| 2018 | $4,743 | $104,360 | $13,360 | $91,000 |
| 2017 | $4,661 | $107,000 | $13,360 | $93,640 |
| 2016 | $2,661 | $105,640 | $13,360 | $92,280 |
| 2015 | $2,655 | $105,240 | $12,960 | $92,280 |
| 2014 | $2,371 | $105,240 | $12,960 | $92,280 |
| 2013 | -- | $4,680 | $4,680 | $0 |
Source: Public Records
Map
Nearby Homes
- 1141 Carillon Dr SE
- 2304 Northglenn Ct
- 2405 Brisbane Dr
- 1709 Grove Ct SE
- 1500 Kathryn's Glen Dr SE
- 1500 Kathryns Glen SE
- 1001 Fox St SE
- 1332 Wild Rose Dr SE
- 2513 Riverton Dr
- 464 Reflection Creek Dr
- 440 Reflection Creek Dr
- 452 Reflection Creek Dr
- 1270 Peeks Ford Rd SE
- 3180 Highway 20 SE
- 3265 Highway 20 SE
- 3446 Richmond Dr SE
- 853 Waterside Dr SE
- 1406 Windy Ridge Ct SE
- 3488 Richmond Dr SE
- 2068 Reflection Creek Dr
- 2070 Reflection Creek Dr
- 2066 Reflection Creek Dr
- 1245 Branlee Dr SE Unit 17
- 1245 Branlee Dr SE
- 1246 Branlee Dr SE Unit 16
- 1246 Branlee Dr SE
- 2064 Reflection Creek Dr
- 2072 Reflection Creek Dr
- 2069 Reflection Creek Dr
- 1243 Branlee Dr SE Unit 18
- 1243 Branlee Dr SE
- 1242 Branlee Dr SE Unit 15
- 1242 Branlee Dr SE
- 2071 Reflection Creek Dr
- 2062 Reflection Creek Dr
- 2074 Reflection Creek Dr
- 1081 Fox St SE
- 1081 Fox St SE Unit 11
- 1148 Carillon Dr SE