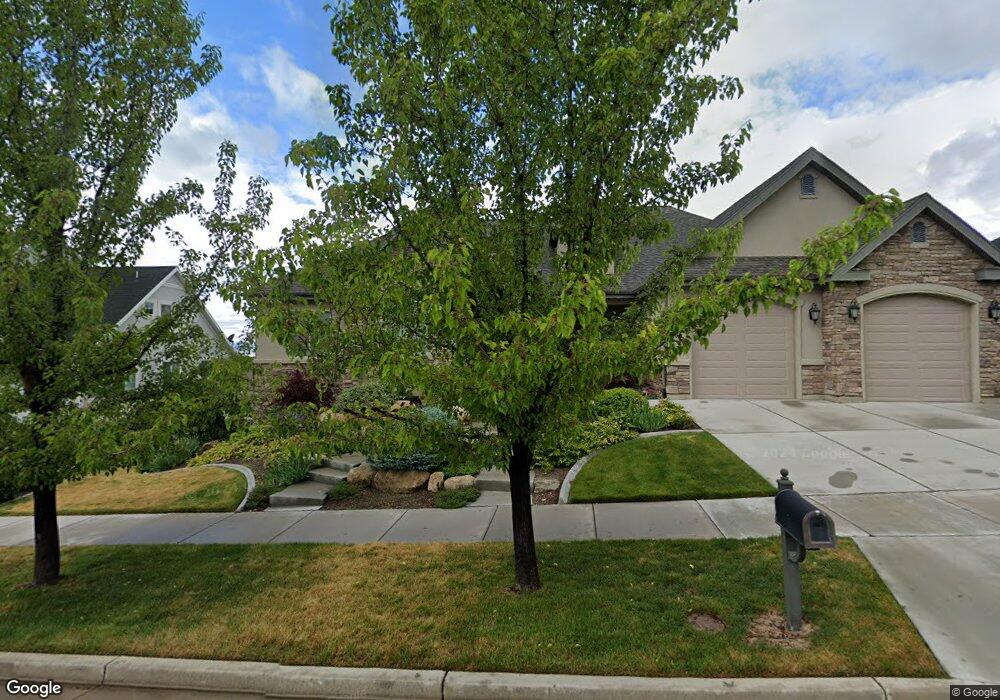
2068 S 160 E Orem, UT 84058
Cherry Hill NeighborhoodEstimated Value: $765,959 - $945,000
3
Beds
4
Baths
2,328
Sq Ft
$361/Sq Ft
Est. Value
About This Home
This home is located at 2068 S 160 E, Orem, UT 84058 and is currently estimated at $839,986, approximately $360 per square foot. 2068 S 160 E is a home with nearby schools including Cherry Hill Elementary School, Lakeridge Jr High School, and Mountain View High School.
Ownership History
Date
Name
Owned For
Owner Type
Purchase Details
Closed on
Sep 20, 2012
Sold by
Jorgensen Mary Ann
Bought by
Jorgensen Mary Ann Gardner
Current Estimated Value
Purchase Details
Closed on
Sep 7, 2012
Sold by
Jorgensen Theron Don and Jorgensen Mary Ann
Bought by
Jorgensen Mary Ann Gardner and Jorgensen Theron Don
Purchase Details
Closed on
Oct 17, 2011
Sold by
Jorgensen Theron Don and Jorgensen Mary Ann
Bought by
Jorgensen Theron Don and Jorgensen Mary Ann
Purchase Details
Closed on
Jan 4, 2008
Sold by
Bankhead Holdings Llc
Bought by
Jorgensen Theron Don and Jorgensen Mary Ann G
Purchase Details
Closed on
Nov 26, 2007
Sold by
The Cliffs Llc
Bought by
Bankhead Holdings Llc
Create a Home Valuation Report for This Property
The Home Valuation Report is an in-depth analysis detailing your home's value as well as a comparison with similar homes in the area
Home Values in the Area
Average Home Value in this Area
Purchase History
| Date | Buyer | Sale Price | Title Company |
|---|---|---|---|
| Jorgensen Mary Ann Gardner | -- | None Available | |
| Jorgensen Mary Ann Gardner | -- | None Available | |
| Jorgensen Theron Don | -- | None Available | |
| Jorgensen Theron Don | -- | Select Title Insurance Agen | |
| Bankhead Holdings Llc | -- | Utah First Title Insurance |
Source: Public Records
Tax History
| Year | Tax Paid | Tax Assessment Tax Assessment Total Assessment is a certain percentage of the fair market value that is determined by local assessors to be the total taxable value of land and additions on the property. | Land | Improvement |
|---|---|---|---|---|
| 2025 | $3,364 | $433,895 | -- | -- |
| 2024 | $3,160 | $411,400 | $0 | $0 |
| 2023 | $3,160 | $415,250 | $0 | $0 |
| 2022 | $3,117 | $396,880 | $0 | $0 |
| 2021 | $3,042 | $586,600 | $195,400 | $391,200 |
| 2020 | $2,862 | $542,500 | $169,900 | $372,600 |
| 2019 | $2,725 | $537,000 | $169,900 | $367,100 |
| 2018 | $2,693 | $507,100 | $169,900 | $337,200 |
| 2017 | $2,765 | $278,905 | $0 | $0 |
| 2016 | $2,998 | $278,905 | $0 | $0 |
| 2015 | $3,170 | $278,905 | $0 | $0 |
| 2014 | $2,659 | $232,815 | $0 | $0 |
Source: Public Records
Map
Nearby Homes
- 2086 S 160 E Unit 7
- 2086 S 160 E
- 140 E 2000 S
- 2079 S 160 E
- 2060 S 180 E
- 2044 S 160 E
- 171 E 2100 S Unit 22
- 171 E 2100 S
- 234 S 180 E
- 236 S 180 E
- 162 E 2100 S
- 162 E 2100 S Unit 8
- 2043 S 160 E
- 115 E 2075 S
- 136 E 2000 S
- 167 E 2050 S Unit 15
- 167 E 2050 S Unit 16
- 167 E 2050 S
- 2036 S 160 E
- 164 E 1780 S Unit 10
Your Personal Tour Guide
Ask me questions while you tour the home.