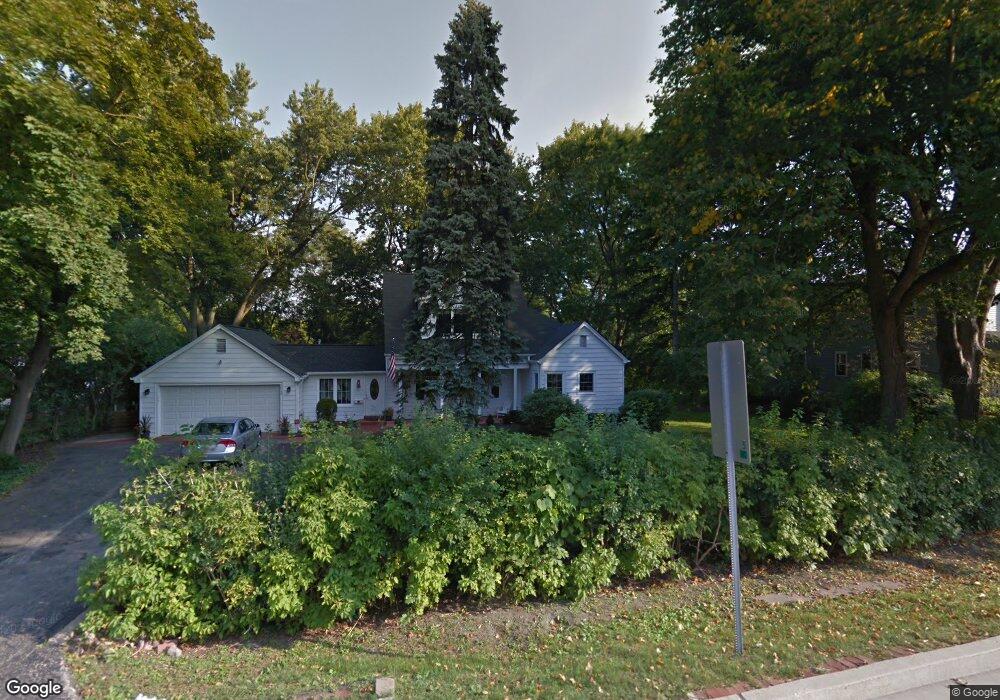
2068 Techny Rd Northbrook, IL 60062
Estimated Value: $564,000 - $839,231
2
Beds
2
Baths
1,609
Sq Ft
$437/Sq Ft
Est. Value
About This Home
This home is located at 2068 Techny Rd, Northbrook, IL 60062 and is currently estimated at $703,558, approximately $437 per square foot. 2068 Techny Rd is a home located in Cook County with nearby schools including Wescott Elementary School, Maple School, and Glenbrook North High School.
Ownership History
Date
Name
Owned For
Owner Type
Purchase Details
Closed on
Nov 22, 2019
Sold by
Bocen Marian and Popovici Christiana M
Bought by
Fetzer Peter and Fetzer Peter D
Current Estimated Value
Home Financials for this Owner
Home Financials are based on the most recent Mortgage that was taken out on this home.
Original Mortgage
$300,000
Outstanding Balance
$263,014
Interest Rate
3.75%
Mortgage Type
New Conventional
Estimated Equity
$440,544
Purchase Details
Closed on
Nov 23, 2015
Sold by
Papa Rene
Bought by
Bocea Marian and Popovici Cristina M
Home Financials for this Owner
Home Financials are based on the most recent Mortgage that was taken out on this home.
Original Mortgage
$388,000
Interest Rate
3.78%
Mortgage Type
New Conventional
Purchase Details
Closed on
Oct 26, 2010
Sold by
Strauss Steven C
Bought by
Papa Rene
Purchase Details
Closed on
Dec 16, 2009
Sold by
Strauss Steven
Bought by
Ebert David A
Create a Home Valuation Report for This Property
The Home Valuation Report is an in-depth analysis detailing your home's value as well as a comparison with similar homes in the area
Home Values in the Area
Average Home Value in this Area
Purchase History
| Date | Buyer | Sale Price | Title Company |
|---|---|---|---|
| Fetzer Peter | $375,000 | Fidelity National Title | |
| Bocea Marian | $400,000 | Premier Title | |
| Papa Rene | $200,000 | None Available | |
| Ebert David A | $300,000 | None Available |
Source: Public Records
Mortgage History
| Date | Status | Borrower | Loan Amount |
|---|---|---|---|
| Open | Fetzer Peter | $300,000 | |
| Previous Owner | Bocea Marian | $388,000 | |
| Closed | Ebert David A | $0 |
Source: Public Records
Tax History
| Year | Tax Paid | Tax Assessment Tax Assessment Total Assessment is a certain percentage of the fair market value that is determined by local assessors to be the total taxable value of land and additions on the property. | Land | Improvement |
|---|---|---|---|---|
| 2025 | $11,273 | $58,000 | $29,995 | $28,005 |
| 2024 | $11,273 | $51,010 | $25,510 | $25,500 |
| 2023 | $10,942 | $51,010 | $25,510 | $25,500 |
| 2022 | $10,942 | $51,010 | $25,510 | $25,500 |
| 2021 | $8,891 | $37,566 | $27,700 | $9,866 |
| 2020 | $8,862 | $37,566 | $27,700 | $9,866 |
| 2019 | $8,526 | $41,282 | $27,700 | $13,582 |
| 2018 | $10,172 | $45,112 | $24,402 | $20,710 |
| 2017 | $9,978 | $45,112 | $24,402 | $20,710 |
| 2016 | $9,165 | $45,112 | $24,402 | $20,710 |
| 2015 | $8,566 | $38,396 | $20,445 | $17,951 |
| 2014 | $8,365 | $38,396 | $20,445 | $17,951 |
| 2013 | $8,244 | $38,396 | $20,445 | $17,951 |
Source: Public Records
Map
Nearby Homes
- 2090 Shermer Rd
- 1817 Somerset Ln Unit 24
- 1772 Lancaster Way
- 1941 Kingsley Cir
- 1914 Farnsworth Ln Unit 208
- 1914 Farnsworth Ln Unit 303
- 2117 Illinois Rd
- 2307 Woodlawn Rd
- 2050 Valencia Dr Unit 300C
- 2050 Valencia Dr Unit 405C
- 2329 Illinois Rd
- 1455 Shermer Rd Unit 406C
- 2347 Oak Ave
- 2335 Maple Ave
- 3100 Lexington Ln Unit 312
- 1943 Sunnyside Cir
- 1443 Church St
- 1444 Sycamore Ln
- 2533 Windsor Ln
- 2571 Essex Dr
- 2068 Techny Rd
- 2080 Techny Rd
- 2056 Techny Rd
- 1940 Somerset Ln Unit 57
- 1944 Somerset Ln Unit 58
- 1941 Somerset Ln Unit 60
- 2092 Techny Rd
- 1945 Somerset Ln Unit 59
- 2044 Techny Rd
- 2100 Techny Rd
- 1971 Summerton Place
- 1933 Somerset Ln Unit 62
- 2067 Techny Rd
- 2021 2nd St
- 1959 Summerton Place
- 2055 Techny Rd
- 1917 Somerset Ln Unit 66
- 1932 Somerset Ln Unit 55
- 1929 Somerset Ln Unit 63
- 1925 Somerset Ln Unit 64
Your Personal Tour Guide
Ask me questions while you tour the home.