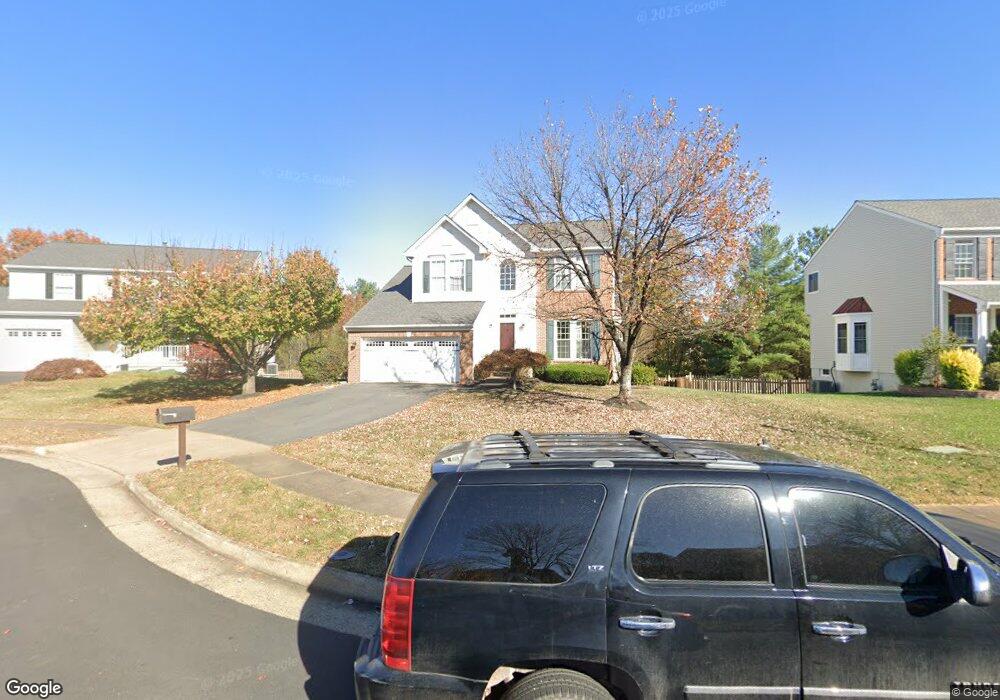
20686 Pomeroy Ct Ashburn, VA 20147
Estimated Value: $918,000 - $941,000
4
Beds
4
Baths
2,772
Sq Ft
$336/Sq Ft
Est. Value
About This Home
This home is located at 20686 Pomeroy Ct, Ashburn, VA 20147 and is currently estimated at $930,414, approximately $335 per square foot. 20686 Pomeroy Ct is a home located in Loudoun County with nearby schools including Ashburn Elementary School, Farmwell Station Middle School, and Broad Run High School.
Ownership History
Date
Name
Owned For
Owner Type
Purchase Details
Closed on
Mar 19, 2018
Sold by
Riner John E and Riner Cheryl
Bought by
Riner John E
Current Estimated Value
Purchase Details
Closed on
Feb 14, 2005
Sold by
Hontanon Ramon J
Bought by
Riner John E
Home Financials for this Owner
Home Financials are based on the most recent Mortgage that was taken out on this home.
Original Mortgage
$463,920
Outstanding Balance
$237,043
Interest Rate
5.83%
Mortgage Type
New Conventional
Estimated Equity
$693,371
Purchase Details
Closed on
Mar 20, 1997
Sold by
Nvr Homes Inc
Bought by
Hontanon Ramon J and Hontanon Stacia S
Home Financials for this Owner
Home Financials are based on the most recent Mortgage that was taken out on this home.
Original Mortgage
$188,050
Interest Rate
7.68%
Mortgage Type
New Conventional
Create a Home Valuation Report for This Property
The Home Valuation Report is an in-depth analysis detailing your home's value as well as a comparison with similar homes in the area
Home Values in the Area
Average Home Value in this Area
Purchase History
| Date | Buyer | Sale Price | Title Company |
|---|---|---|---|
| Riner John E | -- | None Available | |
| Riner John E | $579,900 | -- | |
| Hontanon Ramon J | $235,060 | -- |
Source: Public Records
Mortgage History
| Date | Status | Borrower | Loan Amount |
|---|---|---|---|
| Open | Riner John E | $463,920 | |
| Previous Owner | Hontanon Ramon J | $188,050 |
Source: Public Records
Tax History Compared to Growth
Tax History
| Year | Tax Paid | Tax Assessment Tax Assessment Total Assessment is a certain percentage of the fair market value that is determined by local assessors to be the total taxable value of land and additions on the property. | Land | Improvement |
|---|---|---|---|---|
| 2025 | $6,651 | $826,220 | $299,300 | $526,920 |
| 2024 | $6,702 | $774,750 | $294,300 | $480,450 |
| 2023 | $6,537 | $747,110 | $294,300 | $452,810 |
| 2022 | $6,295 | $707,290 | $269,300 | $437,990 |
| 2021 | $6,054 | $617,760 | $219,300 | $398,460 |
| 2020 | $5,987 | $578,410 | $197,900 | $380,510 |
| 2019 | $5,934 | $567,800 | $197,900 | $369,900 |
| 2018 | $5,612 | $517,230 | $177,900 | $339,330 |
| 2017 | $5,686 | $505,390 | $177,900 | $327,490 |
| 2016 | $5,771 | $503,980 | $0 | $0 |
| 2015 | $5,860 | $338,420 | $0 | $338,420 |
| 2014 | $5,813 | $325,420 | $0 | $325,420 |
Source: Public Records
Map
Nearby Homes
- 20754 Adams Mill Place
- 44397 Adare Manor Square
- 44461 Blueridge Meadows Dr
- 20831 Adams Mill Place
- 44424 Livonia Terrace
- 44152 Natalie Terrace Unit 201
- 44465 Maltese Falcon Square
- 20600 Cornstalk Terrace Unit 202
- 20861 Killawog Terrace
- 20432 Cool Fern Square
- 20402 Cool Fern Square
- 44180 Shady Glen Terrace
- 20759 Crescent Pointe Place
- 20763 Crescent Pointe Place
- 44092 Natalie Terrace Unit 302
- 44084 Natalie Terrace Unit 301
- 20961 Cohasset Terrace
- 44049 Florence Terrace
- 44532 Stepney Dr
- 44383 Agawam Terrace
- 20690 Pomeroy Ct
- 20682 Pomeroy Ct
- 20694 Pomeroy Ct
- 20678 Pomeroy Ct
- 20691 Pomeroy Ct
- 20687 Pomeroy Ct
- 20698 Pomeroy Ct
- 20679 Pomeroy Ct
- 20683 Pomeroy Ct
- 20699 Pomeroy Ct
- 20708 Rainsboro Dr
- 44297 Cuba Mills Ct
- 20712 Rainsboro Dr
- 20714 Fenwick Dr
- 20563 Crescent Pointe Place
- 20555 Crescent Pointe Place
- 20704 Rainsboro Dr
- 20567 Crescent Pointe Place
- 20551 Crescent Pointe Place
- 44293 Cuba Mills Ct